 Fourplex
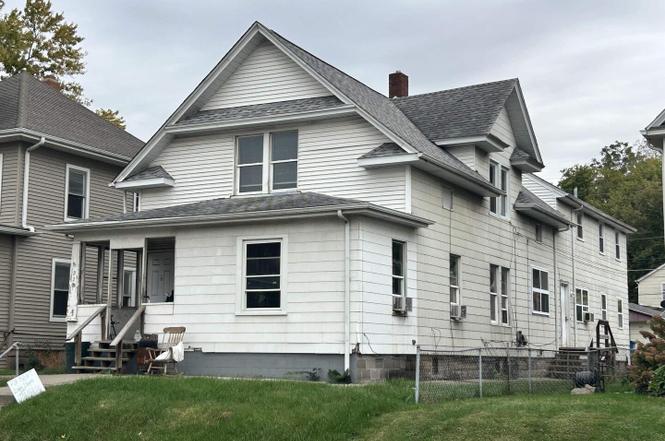
512 17th Ave #4 · East Moline, IL
Flood risk 1/10 · Minimal
- FEMA flood zone
- X (unshaded)
- Chance of flooding over 30 yrs
- 0.0%
- Est. flood insurance / yr
- $507 – $1,088
Fire risk 1/10 · Minimal
- Est. fire insurance / yr
- $804 – $1,492
Heat risk 3/10 · Minor
- Hot days now (above 104°F)
- 7 days/yr
- Hot days in 30 yrs
- 17 days/yr
Wind risk 2/10 · Minimal
- Chance of severe wind over 30 yrs
- —
Air-quality risk 3/10 · Minor
- Unhealthy air days now
- 2 days/yr
- Unhealthy air days in 30 yrs
- 3 days/yr
Risk factors via First Street. Map © Google.
Why this score? — see what drove the B- grade
The composite is a weighted blend of 9 inputs, each scored 0–100. Each bar is that input's sub-score; the figure is the points it added to the 100-point composite (weight × sub-score).
- Cash flow +30.0/30.0
- 1% rule +10.0/10.0
- DSCR +10.0/10.0
- ARV discount +7.5/15.0
- Livability +3.1/5.0
- Rent growth +2.5/5.0
- Condition / age +2.5/5.0
- Schools +1.2/10.0
- Appreciation +0.0/10.0
$149,900
🖨 Deal sheet 📄 Offer letter ✓ Due diligence
Multi-family units
County records classify this as Multi-Family (2-4 Unit). Listing-text estimate: 4 units. confirmed
Listing remarks
This 4 plex in East Moline is looking for its next investor. 3- 2 bedroom units and 1-3 bedroom unit, basement access for additional storage space with parking behind building. Unit 1 (2 Bed) is currently occupied with month-to-month lease @$750, Unit 2 (3 Bed) is currently occupied month-to-month lease @$950, Unit 3 (2 Bed) is currently open but re-painted and ready to lease @ $850, Unit 4 (2 Bed Jack & Jill Style) is occupied with a year lease @ $850. Total monthly income is $3400, yearly is $40,800, and owner pays all utilities. Tenants Right so 24 hour to show.
Key facts
- Built 1925
Neighborhood map
What this means for you Summary
Snapshot
- This is a 3×2bd/1.0ba + 1×3bd/1.0ba units multifamily listed at $150k.
Deal economics
- At list price, monthly cash flow is $2k ($28k/yr) — positive. Per door: $589/mo.
- The deal already cash-flows at list — no discount required.
- Meets the 1% rule at list price ($4k rent vs $150k).
- Cap rate 25.1% vs local median 3.5% in East Moline — top-decile yield for the area; either an underpriced asset or a hidden risk that comps aren't pricing in. Stress-test before assuming the spread holds.
Location & tenants
- Location reads 62/100 on livability (#870 in IL) — a middle-class / working-renter tenant base. Strengths: cost of living A+, housing A+; Watch: crime C-, employment C-, schools F.
- United Twp Hsd 30 (suburban): math 12% / reading 15% proficiency, ranked #536 of 620 in IL (top 86%) — low school quality limits family demand, transient renter base, plan for 1-2y turnover.
- Market conditions: 124 active listings in the ZIP; 116 units permitted in Rock Island County in 2024 (50 in 5+ unit buildings).
- At $4,292/mo this rent would consume 81% of the median local household income ($64k/yr) (locally 746% of renters already pay >50% of income on rent) — very limited rent-growth headroom before tenants either downsize or default.
Forward outlook
- Local home prices are declining (-3.0%/yr); year-one equity from $1k of loan paydown is wiped out by about $4k of value loss. Plan a longer hold.
- Rock Island County population projected at -12% by 2050 — secular population decline; favor cash flow + early exit over multi-decade hold.
- At projected returns (-3.0% appreciation + 3.0% rent growth), your $42k cash investment doubles in ~2 years — after that, you're playing with house money.
Negotiation context
- Only 0 days on market — expect competitive offers; lowballing is unlikely to land.
- 2 sale attempts with the ask held roughly flat each time — persistent listings suggest the price (not the market) is what's stuck; bring a comps-based counter.
Risks & watch-outs
- Watch-outs: built in 1925 — expect roof / HVAC / electrical / plumbing capex.
Questions for the listing agent
- Can we see the unit-by-unit rent roll, current vacancy, and any below-market leases? What's the average tenancy length?
- What capital expenditures (roof, boiler, parking lot, exteriors) have been made in the last 5 years, and what's planned in the next 2?
- Built in 1925 — when were the roof, HVAC, electrical panel, plumbing, and water heater last replaced?
- Is there a deadline driving the sale (1031 exchange, divorce, estate, relocation)? That informs how much negotiation room exists.
- Schools are F-rated, which usually means shorter tenancies and higher turnover. Who's the typical renter profile here, and what's been the actual vacancy rate?
- What's the average days-on-market for RENTAL listings here right now (not sales)? A rising rental-DOM trend means longer vacancies and softer asking-rent achievability than the comps imply.
- What's the recent tenant-quality profile in this submarket — average credit score on applications, eviction rate, late-payment / NSF rate, and stable-employment percentage? A property-management company in the area should have these aggregated.
- How much new apartment / multifamily construction is in the pipeline within 1–3 miles? Heavy new supply (>2% of stock underway) typically softens rents 12–24 months out; light construction supports rent growth.
Investment metrics
- 1% rule
- 2.86% ✓
- Cap rate
- 25.14%
- Cash-on-cash
- 67.32%
- DSCR
- 4.00
- GRM
- 2.9
CMA / ARV
No comps found within radius.
Show comp detail 1 sale within ~0.75 mi
| Address | Dist | Beds/Ba | Sqft | Sold | Price | $/sf | Match |
|---|---|---|---|---|---|---|---|
| 512 17th Ave #4 | 0.00mi | 9/4.0 (+1) | 3,628 | 5mo | $147,000 | $41 | 78 |
Match score weights: distance 35% · size 25% · config 20% · recency 20%. Top-matched comps best support the ARV.
Projected returns pro-forma
-3.0% appreciation · 3.0% rent growth · sell at horizon
- IRR
- 66.7%
- Equity multiple
- 4.00×
- Total profit
- $125,750
- Equity at exit
- $22,351
- IRR
- 70.9%
- Equity multiple
- 8.22×
- Total profit
- $302,882
- Equity at exit
- $12,961
Cash invested: $41,972 (down + closing). Projections, not guarantees.
Landlord ↔ Tenant lean methodology
- Overall (STATE)
- 43 Moderately Tenant-Leaning
- State Illinois
- 43 Moderately Tenant-Leaning · D+7
- County
- — inherits STATE
- City
- — inherits STATE
ZIP-level market 61244
- Active inventory
- 124
- Price-to-rent
- 11.8×
Monthly cashflow live
- Estimated rent
- $4,292 high interval (Pro) →
- Mortgage (P&I)
- −$786
- Tax est. 1.5%
- −$187 /mo · $2,248/yr
- Insurance
- −$62
- HOA
- −$0
- Vacancy / Maint / Mgmt
- −$901
- Net cashflow
- $2,355
Break-even live
4-unit breakdown (identical units grouped — click to expand)
| Units | Beds | Baths | Est. rent |
|---|---|---|---|
| 3× units | 2 | 1 | $3,177 |
| #1 | 2 | 1 | $1,059 |
| #2 | 2 | 1 | $1,059 |
| #3 | 2 | 1 | $1,059 |
| 1× unit | 3 | 1 | $1,114 |
| Total (4 units) | $4,292 | ||
UW: 25.0% down · 7.5% · 30yr · 1.5% tax · 5.0% vac · 8.0% maint · 8.0% mgmt
Financing live
Cash to close
- Down payment
- $37,475
- Closing costs
- $4,497
- Reserves months
- —
- Total cash needed
- —
Loan-product check · same deal, 3 products live
Conventional
25% down · 7.5% · 30yr
- Down + closing
- —
- Monthly P&I
- —
- Monthly cashflow
- —
- DSCR
- —
- Eligible?
- —
Personal DTI + credit; lowest rate.
DSCR
20% down · 8.5% · 30yr
- Down + closing
- —
- Monthly P&I
- —
- Monthly cashflow
- —
- DSCR
- —
- Eligible?
- —
No personal income docs; deal must DSCR.
Hard money
10% down · 12.0% · 12mo
- Down + closing
- —
- Monthly P&I
- —
- Monthly cashflow
- —
- DSCR
- —
- Eligible?
- —
Short-term bridge; refi at stabilization.
Listing history 14 events
-
2026-05-24status Pending
-
2026-05-24status Pending
-
2026-05-22status Pending
-
2026-01-09soldstatus $147,000 Closed
-
2026-01-09soldstatus $147,000 Closed
-
2026-01-09soldstatus $147,000 Closed
-
2026-01-09soldstatus $147,000 Closed
-
2026-01-08status Pending
-
2026-01-05historical
-
2025-12-05status Pending
-
2025-12-05historical
-
2025-12-05historical
-
2025-10-15$149,900
-
2025-10-15Active
ⓘ Source: listings_history table (triggers on properties + properties_extension) + one-shot
backfill from property_details.listing_events for pre-trigger history.
Climate risk First Street
- Flood 1/10 Low FEMA zone X (unshaded) · 0% chance over 30 yrs
- Wildfire 1/10 Low
- Heat 3/10 Moderate 7 d/yr ≥104°F today · 17 d/yr by 30 yrs out
- Wind 2/10 Low
- Air quality 3/10 Moderate 2 unhealthy d/yr today · 3 by 30 yrs out
Nearby sold comps map
Loading sold comps map…
Walkable amenities ~0.75 mi
Loading nearby amenities…
Taxation est. · year 1
- Rental income
- $51,504
- − Mortgage interest
- −$8,397
- − Property taxes
- −$2,248
- − Insurance
- −$750
- − Repairs & maintenance
- −$4,120
- − Management
- −$4,120
- − Depreciation
- −$4,361
- Taxable income
- $27,508
- Est. tax owed @ 24.0%
- −$6,602
- After-tax cash flow
- $21,655/yr
For passive investors: Depreciation is non-cash, so a rental often shows a tax loss while cash-flowing — sheltering income. Rental losses are passive: they offset passive income freely, and up to $25,000/yr can offset ordinary (W-2) income if you actively participate and your MAGI is under $100k (phasing out to $0 by $150k); unused losses carry forward. On sale, claimed depreciation is recaptured at up to 25%, and gains may owe capital-gains tax (a 1031 exchange can defer both). Figures are a year-1 estimate at your 24.0% rate — not tax advice; consult a CPA.
Schools (NCES district)
- District
- United Twp Hsd 30
- NCES district ID
- 1739870
- Math proficiency
- 12% ▼ -5.00%
- Reading proficiency
- 15% ▼ -6.00%
- Median HH income
- $43,647
- Composite
- 11.91/100
- National rank
- #9670
- State rank
- #536 of 620 in IL
Livability — East Moline
- Score
- 62/100
- State rank
- #870
- US rank
- #16964
Category grades
Schools grade is shown separately in the Schools card above.
Census & demographics
- Census place
- East Moline, IL
- County
- Rock Island County · 103,822 people
- City population
- 23,308
- Metro
- Davenport-Moline-Rock Island, IA-IL
- Population (ZIP)
- 23,308
- Household income
- $63,819
- Rent vs Own
- Severe rent burden
- 746.0
Population outlook (Rock Island County) Hauer SSP2
- Today (2025)
- 140,982 people
- By 2030
- 137,705 · -2.3%
- By 2040
- 130,512 · -7.4%
- By 2050
- 123,841 · -12.2%
- By 2075
- 109,851 · -22.1%
- By 2100
- 90,922 · -35.5%
Race, ethnicity, and origin ACS 2023
- Neighborhood character
- Diverse neighborhood (Simpson 0.62)
- Race & ethnicity
- White 55% Hispanic / Latino 19% Black 18% Two or more races 9% Asian 3%
- Hispanic origin (detail)
- Mexican 17%
- Common ancestry
- English 3% Lithuanian 2% Romanian 2%
- Foreign-born
- 13% · Canada, United Kingdom, Philippines
- Languages at home
- 78% English-only · Spanish 12% French/Haitian/Cajun 3% Other Asian/Pacific 2%
Political lean MEDSL · Rock Island
- 2024 margin
- Lean D (+9.6) · D 53.9% · R 44.4% · Other 1.7%
- 2008→2024 swing
- -15.0pp toward R · 2008: 24.6pp · 2024: 9.6pp
- All cycles
- 2024: D+9.6 2020: D+12.1 2016: D+8.4 2012: D+21.9 2008: D+24.6
Not yet ingested
- Civics
- —
Market trends
- HPI YoY
- ▼ -108.05%
- Current HPI
- 154.4012
- Rent YoY
- —
- Metro
- Davenport-Moline-Rock Island, IA-IL
- State GDP YoY
- ▲ 1.59%
- F500 in state
- 60
Industry mix (Fortune 500 HQ in IL)
| Industry | F500 HQs | Revenue |
|---|---|---|
| Insurance | 4 | $201B |
|
||
| Consumer Goods | 4 | $87B |
|
||
| Industrial Machinery | 3 | $64B |
|
||
| Healthcare | 2 | $55B |
|
||
| Retail / Pharmacy | 1 | $148B |
|
||
| Agriculture / Food | 1 | $86B |
|
||
Price history
-1.9% since first listed14 events — show timeline
- 2026-05-24 Pending — MRED as Distributed by MLS Grid
- 2026-05-24 Pending — MRED as Distributed by MLS Grid
- 2026-05-22 Pending — MRED as Distributed by MLS Grid
- 2026-01-09 Sold (MLS) $147,000 MRED as Distributed by MLS Grid
- 2026-01-09 Sold (MLS) $147,000 MRED as Distributed by MLS Grid
- 2026-01-09 Sold (MLS) $147,000 MRED as Distributed by MLS Grid
- 2026-01-09 Sold (MLS) $147,000 MRED as Distributed by MLS Grid
- 2026-01-08 Pending — MRED as Distributed by MLS Grid
- 2026-01-05 Listing Removed — MRED as Distributed by MLS Grid
- 2025-12-05 Pending — RMLSA as Distributed by MLS Grid
- 2025-12-05 Listing Removed — RMLSA as Distributed by MLS Grid
- 2025-12-05 Listing Removed — MRED as Distributed by MLS Grid
- 2025-10-15 Listed — RMLSA as Distributed by MLS Grid
- 2025-10-15 Listed $149,900 MRED as Distributed by MLS Grid
Cash-flow waterfall
monthlySold comps — $/sqft
last 12 mo · ≤1 miLoading sold comps…