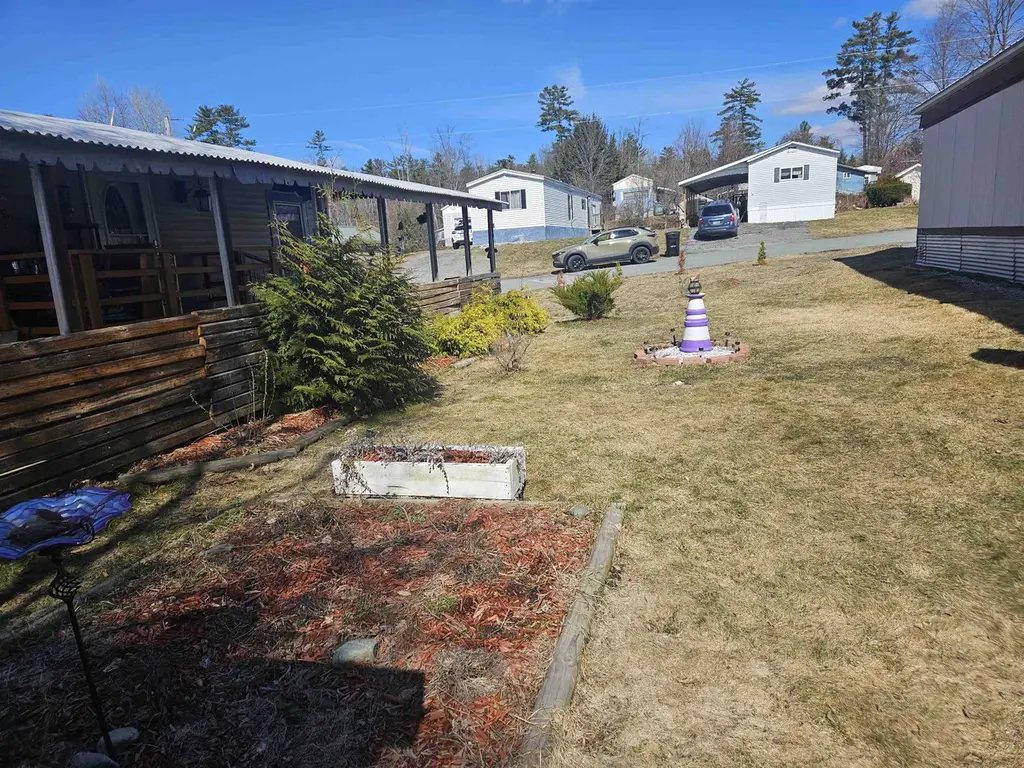
20 Fiske Pl
Claremont, NH 03743
$55,000B+
3 bd · 1.5 ba ·
924 sqft ·
Built 1980
· Manufactured
· Pending
· 5 DOM
Cashflow @ list (25.0% down · 7.5%)
Estimated rent
$1,922/mo
Mortgage (P&I)
−$288
Tax + insurance
−$89
HOA
−$415
Vac / Maint / Mgmt
−$404
Net cashflow
$725/mo
Annual
$8,704/yr
Cap rate
22.12%
Cash-on-cash
56.52%
DSCR
3.51
1% rule
3.49%
Cash to close
$15,400
Investor read
- This is a 3-bed/1.5-bath manufactured listed at $55k.
- At list price, monthly cash flow is $725 ($9k/yr) — positive.
- The deal already cash-flows at list — no discount required.
- Meets the 1% rule at list price ($2k rent vs $55k).
- Only 5 days on market — expect competitive offers; lowballing is unlikely to land.
- In year one you build about $491 of equity ($380 loan paydown + $111 appreciation (0.2% local appreciation)).
- Location reads 69/100 on livability (#50 in NH) — a middle-class / working-renter tenant base. Strengths: cost of living A+, health & safety A+, housing A; Watch: employment C-, amenities F, commute F.
- Claremont School District (town): math 24% / reading 35% proficiency, ranked #85 of 98 in NH (top 87%) — low school quality limits family demand, transient renter base, plan for 1-2y turnover.
- Zoned schools: Disnard Elementary School (math 17% / reading 27%, grade F, #242 of 263 statewide, top 92%, 237 students, 48% FRL) — zoned schools at 48% FRL track the district average.
- Watch-outs: HOA is 22% of rent.
- Market conditions: 58 active listings in the ZIP; 98 units permitted in Sullivan County in 2024 (0 in 5+ unit buildings).
- Sullivan County population projected at -20% by 2050 — secular population decline; favor cash flow + early exit over multi-decade hold.
- 2 sale attempts since 14y ago; this cycle's ask is 10% above the opening price — seller raised mid-cycle; expect resistance to lowballs.
- Current owner paid $5k; list at $55k implies a 1000% gain — meaningful room to come down on a strong offer.
- At projected returns (0.2% appreciation + 3.0% rent growth), your $15k cash investment doubles in ~2 years — after that, you're playing with house money.
- Cap rate 22.1% vs local median 3.2% in Claremont — top-decile yield for the area; either an underpriced asset or a hidden risk that comps aren't pricing in. Stress-test before assuming the spread holds.
- This rent runs 39% of the median local income ($60k/yr) — at the standard rent-burdened threshold; future hikes will face affordability resistance.
Questions for listing agent
- What does the HOA fee cover, when was the last increase, and are there any pending special assessments or reserve-fund shortfalls?
- Is there a deadline driving the sale (1031 exchange, divorce, estate, relocation)? That informs how much negotiation room exists.
- Schools are D-rated, which usually means shorter tenancies and higher turnover. Who's the typical renter profile here, and what's been the actual vacancy rate?
- What's the average days-on-market for RENTAL listings here right now (not sales)? A rising rental-DOM trend means longer vacancies and softer asking-rent achievability than the comps imply.
- What's the recent tenant-quality profile in this submarket — average credit score on applications, eviction rate, late-payment / NSF rate, and stable-employment percentage? A property-management company in the area should have these aggregated.
- How much new for-sale + rental construction is in the pipeline within 1–3 miles? Heavy new supply typically softens prices + rents 12–24 months out; constrained supply supports both.
CashFlowRE · CFR-T7C240EVFHSBNW
· Data 3 weeks ago
cashflowre.app · 2026-05-29