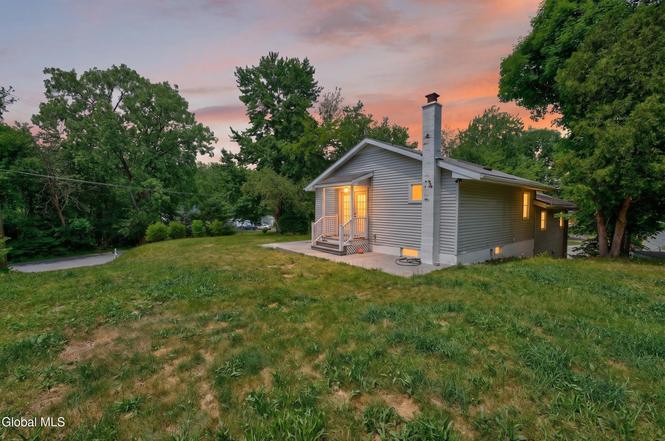
78 Tollgate Rd
Averill Park, NY 12018
$315,000C-
4 bd · 2.0 ba ·
1,225 sqft ·
Built 1958
· SingleFamily
· Active
· 2 DOM
Cashflow @ list (25.0% down · 7.5%)
Estimated rent
$2,727/mo
Mortgage (P&I)
−$1,652
Tax + insurance
−$605
HOA
−$0
Vac / Maint / Mgmt
−$573
Net cashflow
$-102/mo
Annual
$-1,226/yr
Cap rate
5.90%
Cash-on-cash
-1.39%
DSCR
0.94
1% rule
0.87%
Cash to close
$88,200
Investor read
- This is a 4-bed/2.0-bath single-family listed at $315k.
- At list price, monthly cash flow is $-102 ($-1k/yr) — negative.
- To cash-flow at today's rent, offer at most $297k (5.7% below list).
- To meet the 1% rule (rent ≥ 1% of price), the offer needs to be $273k (13.4% below list).
- Only 2 days on market — expect competitive offers; lowballing is unlikely to land.
- Recommended offer: $273k (13.4% below list) — sets the bar for 1% rule.
- In year one you build about $34k of equity ($2k loan paydown + $32k appreciation (10.0% local appreciation)).
- Location reads 80/100 on livability (#101 in NY, #1,641 nationally) — a professional / high-income tenant draw. Strengths: crime A+, employment A+, housing A+; Watch: amenities F, commute F.
- Averill Park Central School District (rural): math 58% / reading 69% proficiency, ranked #169 of 590 in NY (top 29%) — acceptable for families but not a draw, mixed tenant base, ~2y average lease; only 14% free/reduced lunch — higher-income household profile.
- Zoned schools: West Sand Lake Elementary School (math 67% / reading 57%, grade B, #675 of 2,108 statewide, top 35%, 376 students, 18% FRL); Averill Park High School (math 97% / reading 98%, grade A+, #49 of 1,100 statewide, top 5%, 897 students, 25% FRL).
- Zoned-school proficiency averages 80% at this address vs 64% district-wide (+16 pts) — the actual schools serving this property are materially stronger than the Averill Park Central School District average implies; a family-tenant draw the district grade alone would hide.
- Watch-outs: built in 1958 — expect roof / HVAC / electrical / plumbing capex.
- Market conditions: 52 active listings in the ZIP; 405 units permitted in Rensselaer County in 2024 (224 in 5+ unit buildings).
- Rensselaer County population projected to shrink 6% by 2050 — rents likely to lag national; underwrite the cash flow, not the appreciation.
- 6 sale attempts since 26y ago with the ask held roughly flat each time — persistent listings suggest the price (not the market) is what's stuck; bring a comps-based counter.
- By year 2, paydown + projected appreciation supports a ~$54k cash-out refi (75% LTV) — recoverable capital for the next deal without selling this one.
- Climate carrying-cost: major flood risk — expect insurance premiums to compound above CPI over the hold.
Questions for listing agent
- What do current leases actually rent for vs. the listed asking? Can we see a recent rent roll and the last 12 months of T-12 income?
- Built in 1958 — when were the roof, HVAC, electrical panel, plumbing, and water heater last replaced?
- Is there a deadline driving the sale (1031 exchange, divorce, estate, relocation)? That informs how much negotiation room exists.
- Schools are B-rated — typically a magnet for longer-tenancy family renters. What's the average tenant stay here, and is there a school-zone premium baked into asking?
- What's the average days-on-market for RENTAL listings here right now (not sales)? A rising rental-DOM trend means longer vacancies and softer asking-rent achievability than the comps imply.
- What's the recent tenant-quality profile in this submarket — average credit score on applications, eviction rate, late-payment / NSF rate, and stable-employment percentage? A property-management company in the area should have these aggregated.
- How much new for-sale + rental construction is in the pipeline within 1–3 miles? Heavy new supply typically softens prices + rents 12–24 months out; constrained supply supports both.
CashFlowRE · CFR-T7FD2D4AQ04Z4S
· Data 2 days ago
cashflowre.app · 2026-05-29