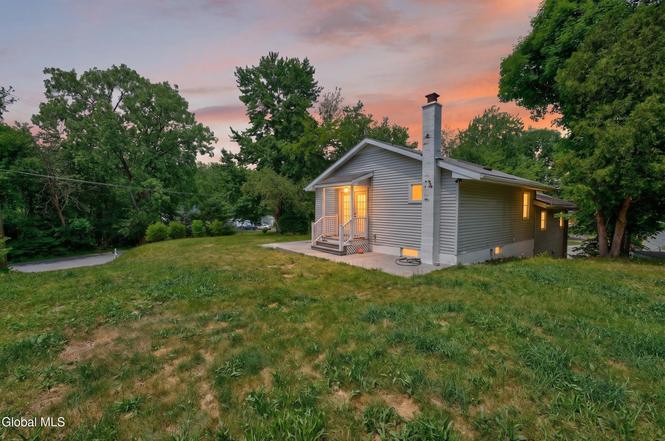
78 Tollgate Rd · Averill Park, NY
Flood risk 6/10 · Moderate
- FEMA flood zone
- X
- Chance of flooding over 30 yrs
- 0.72%
- Est. flood insurance / yr
- $473 – $860
Fire risk 4/10 · Minor
- Est. fire insurance / yr
- $691 – $1,283
Heat risk 3/10 · Minor
- Hot days now (above 93°F)
- 7 days/yr
- Hot days in 30 yrs
- 16 days/yr
Wind risk 3/10 · Minor
- Chance of severe wind over 30 yrs
- 7.0%
Air-quality risk 2/10 · Minimal
- Unhealthy air days now
- 1 days/yr
- Unhealthy air days in 30 yrs
- 1 days/yr
Risk factors via First Street. Map © Google.
Why this score? — see what drove the C- grade
The composite is a weighted blend of 9 inputs, each scored 0–100. Each bar is that input's sub-score; the figure is the points it added to the 100-point composite (weight × sub-score).
- Cash flow +11.5/30.0
- ARV discount +10.1/15.0
- Appreciation +10.0/10.0
- Schools +5.7/10.0
- Livability +4.0/5.0
- 1% rule +3.7/10.0
- DSCR +3.4/10.0
- Rent growth +2.5/5.0
- Condition / age +2.5/5.0
$315,000
🖨 Deal sheet 📄 Offer letter ✓ Due diligence
Listing remarks MLS
Fantastic Opportunity! This beautifully remodeled 4-bedroom, 2-bath home features a sun-filled open floor plan that's perfect for modern living. The spacious kitchen offers abundant cabinetry, brand-new appliances (refrigerator, dishwasher, and microwave), touchfree facet and a generously sized dining area perfect for gatherings. The expansive living room is ideal for entertaining, complete with a charming wood stove. The inviting primary suite includes a refreshed private bath, while the lower level boasts two additional bedrooms and a brand-new full bath. With fresh paint and flooring throughout, a two-car garage, and numerous updates, this home is truly move-in ready. Welcome Home!
Key facts
- Touch-free faucet
- Abundant cabinetry
- Stunning kitchen
Tags
Property features AI
Exterior
- Parking: Attached garage with 2 garage spaces; Additional parking for a total of 4 vehicles; Driveway; Garage door opener; Parking under residence
- Utilities: Public sewer; Cable connected
- Home design: Single-family residence; Updated/remodeled
- Construction: Vinyl siding; Asphalt roof
- Exterior features: Covered patio/porch; Deck; Exterior lighting; Cleared lot
Interior
- Kitchen: Dishwasher; Microwave; Oven; Range; Refrigerator
- Bedrooms: Primary bedroom on second level; Bedrooms on first and second levels (total 4 bedrooms implied by room entries)
- Flooring: Tile; Laminate
- Bathrooms: Two full bathrooms (one on first level, one on second level)
- Heating & cooling: Oil heating with baseboard units
- Interior features: High-speed internet; Sliding doors; Finished basement; Living room with wood-burning fireplace
- Laundry & utility: Washer and dryer included; Main-level laundry room
Neighborhood map
What this means for you Summary
Snapshot
- This is a 4-bed/2.0-bath single-family listed at $315k.
Deal economics
- At list price, monthly cash flow is $-102 ($-1k/yr) — negative.
- To cash-flow at today's rent, offer at most $297k (5.7% below list).
- To meet the 1% rule (rent ≥ 1% of price), the offer needs to be $273k (13.4% below list).
- Recommended offer: $273k (13.4% below list) — sets the bar for 1% rule.
Location & tenants
- Location reads 80/100 on livability (#101 in NY, #1,641 nationally) — a professional / high-income tenant draw. Strengths: crime A+, employment A+, housing A+; Watch: amenities F, commute F.
- Averill Park Central School District (rural): math 58% / reading 69% proficiency, ranked #169 of 590 in NY (top 29%) — acceptable for families but not a draw, mixed tenant base, ~2y average lease; only 14% free/reduced lunch — higher-income household profile.
- Zoned schools: West Sand Lake Elementary School (math 67% / reading 57%, grade B, #675 of 2,108 statewide, top 35%, 376 students, 18% FRL); Averill Park High School (math 97% / reading 98%, grade A+, #49 of 1,100 statewide, top 5%, 897 students, 25% FRL).
- Zoned-school proficiency averages 80% at this address vs 64% district-wide (+16 pts) — the actual schools serving this property are materially stronger than the Averill Park Central School District average implies; a family-tenant draw the district grade alone would hide.
- Market conditions: 52 active listings in the ZIP; 405 units permitted in Rensselaer County in 2024 (224 in 5+ unit buildings).
Forward outlook
- In year one you build about $34k of equity ($2k loan paydown + $32k appreciation (10.0% local appreciation)).
- Rensselaer County population projected to shrink 6% by 2050 — rents likely to lag national; underwrite the cash flow, not the appreciation.
- By year 2, paydown + projected appreciation supports a ~$54k cash-out refi (75% LTV) — recoverable capital for the next deal without selling this one.
Negotiation context
- Only 2 days on market — expect competitive offers; lowballing is unlikely to land.
- 6 sale attempts since 26y ago with the ask held roughly flat each time — persistent listings suggest the price (not the market) is what's stuck; bring a comps-based counter.
Risks & watch-outs
- Watch-outs: built in 1958 — expect roof / HVAC / electrical / plumbing capex.
- Climate carrying-cost: major flood risk — expect insurance premiums to compound above CPI over the hold.
Questions for the listing agent
- What do current leases actually rent for vs. the listed asking? Can we see a recent rent roll and the last 12 months of T-12 income?
- Built in 1958 — when were the roof, HVAC, electrical panel, plumbing, and water heater last replaced?
- Is there a deadline driving the sale (1031 exchange, divorce, estate, relocation)? That informs how much negotiation room exists.
- Schools are B-rated — typically a magnet for longer-tenancy family renters. What's the average tenant stay here, and is there a school-zone premium baked into asking?
- What's the average days-on-market for RENTAL listings here right now (not sales)? A rising rental-DOM trend means longer vacancies and softer asking-rent achievability than the comps imply.
- What's the recent tenant-quality profile in this submarket — average credit score on applications, eviction rate, late-payment / NSF rate, and stable-employment percentage? A property-management company in the area should have these aggregated.
- How much new for-sale + rental construction is in the pipeline within 1–3 miles? Heavy new supply typically softens prices + rents 12–24 months out; constrained supply supports both.
Investment metrics
- 1% rule
- 0.87% ✗
- Cap rate
- 5.90%
- Cash-on-cash
- -1.39%
- DSCR
- 0.94
- GRM
- 9.6
CMA / ARV
- ARV (on-the-fly)
- $334,425
- Comps found
- 4
Show comp detail 4 sales within ~0.75 mi
| Address | Dist | Beds/Ba | Sqft | Sold | Price | $/sf | Match |
|---|---|---|---|---|---|---|---|
| 78 Tollgate Rd | 0.00mi | 4/2.0 | 1,225 (0%) | 17mo | $281,000 | $229 | 86 |
| 74 Tollgate Rd | 0.02mi | 3/1.0 (-1) | 1,134 (-7%) | 7mo | $300,000 | $265 | 72 |
| 18 Fisher Rd | 0.15mi | 3/2.0 (-1) | 1,352 (+10%) | 23mo | $370,000 | $274 | 52 |
| 180 Algonquin Beach Rd | 0.70mi | 3/2.0 (-1) | 1,144 (-7%) | 19mo | $312,000 | $273 | 36 |
Match score weights: distance 35% · size 25% · config 20% · recency 20%. Top-matched comps best support the ARV.
Projected returns pro-forma
10.0% appreciation · 3.0% rent growth · sell at horizon
- IRR
- 23.3%
- Equity multiple
- 2.87×
- Total profit
- $165,143
- Equity at exit
- $283,777
- IRR
- 20.8%
- Equity multiple
- 6.57×
- Total profit
- $491,613
- Equity at exit
- $611,976
Cash invested: $88,200 (down + closing). Projections, not guarantees.
Landlord ↔ Tenant lean methodology
- Overall (STATE)
- 15 Strongly Tenant-Friendly
- State New York
- 15 Strongly Tenant-Friendly · D+10
- County
- — inherits STATE
- City
- — inherits STATE
ZIP-level market 12018
- Home prices YoY
- 4.5%
- Active inventory
- 52
- Price-to-rent
- 9.6×
Monthly cashflow live
- Estimated rent
- $2,727 medium interval (Pro) →
- Mortgage (P&I)
- −$1,652
- Tax from tax record
- −$473 /mo · $5,681/yr
- Insurance
- −$131
- HOA
- −$0
- Vacancy / Maint / Mgmt
- −$573
- Net cashflow
- $-102
Break-even live
UW: 25.0% down · 7.5% · 30yr · 1.5% tax · 5.0% vac · 8.0% maint · 8.0% mgmt
Financing live
Cash to close
- Down payment
- $78,750
- Closing costs
- $9,450
- Reserves months
- —
- Total cash needed
- —
Loan-product check · same deal, 3 products live
Conventional
25% down · 7.5% · 30yr
- Down + closing
- —
- Monthly P&I
- —
- Monthly cashflow
- —
- DSCR
- —
- Eligible?
- —
Personal DTI + credit; lowest rate.
DSCR
20% down · 8.5% · 30yr
- Down + closing
- —
- Monthly P&I
- —
- Monthly cashflow
- —
- DSCR
- —
- Eligible?
- —
No personal income docs; deal must DSCR.
Hard money
10% down · 12.0% · 12mo
- Down + closing
- —
- Monthly P&I
- —
- Monthly cashflow
- —
- DSCR
- —
- Eligible?
- —
Short-term bridge; refi at stabilization.
Listing history 3 events
-
2026-06-18days on market $315,000 Active 2 DOM
-
2026-06-16remarks 699-char remark
-
2026-06-16$315,000 Active 1 DOM
ⓘ Source: listings_history table (triggers on properties + properties_extension) + one-shot
backfill from property_details.listing_events for pre-trigger history.
Tax reassessment forecast NY · Partial reset (capped growth)
- Current annual tax
- $5,681 · $473/mo
- Projected year-2 tax
- $5,681 · $473/mo
- Expected delta
- $0/yr ($0/mo · 0.0%)
ⓘ Screening estimate from a state-policy table — verify with the county assessor before closing.
Climate risk First Street
- Flood 6/10 Major FEMA zone X · 72% chance over 30 yrs
- Wildfire 4/10 Moderate
- Heat 3/10 Moderate 7 d/yr ≥93°F today · 16 d/yr by 30 yrs out
- Wind 3/10 Moderate 7% chance of damaging wind over 30 yrs
- Air quality 2/10 Low 1 unhealthy d/yr today · 1 by 30 yrs out
Nearby sold comps map
Loading sold comps map…
Walkable amenities ~0.75 mi
Loading nearby amenities…
Taxation est. · year 1
- Rental income
- $32,725
- − Mortgage interest
- −$17,645
- − Property taxes
- −$5,681
- − Insurance
- −$1,575
- − Repairs & maintenance
- −$2,618
- − Management
- −$2,618
- − Depreciation
- −$9,164
- Taxable loss
- −$6,575
- Est. tax savings @ 24.0%
- +$1,578
- After-tax cash flow
- $352/yr
For passive investors: Depreciation is non-cash, so a rental often shows a tax loss while cash-flowing — sheltering income. Rental losses are passive: they offset passive income freely, and up to $25,000/yr can offset ordinary (W-2) income if you actively participate and your MAGI is under $100k (phasing out to $0 by $150k); unused losses carry forward. On sale, claimed depreciation is recaptured at up to 25%, and gains may owe capital-gains tax (a 1031 exchange can defer both). Figures are a year-1 estimate at your 24.0% rate — not tax advice; consult a CPA.
Schools (NCES district)
- District
- Averill Park Central School District
- NCES district ID
- 3600016
- Math proficiency
- 58% ▼ -15.00%
- Reading proficiency
- 69% ▲ 2.00%
- Median HH income
- $81,340
- Composite
- 56.94/100
- National rank
- #1113
- State rank
- #169 of 590 in NY
Livability — Averill Park
- Score
- 80/100
- State rank
- #101
- US rank
- #1641
Category grades
Schools grade is shown separately in the Schools card above.
Census & demographics
- Census place
- Averill Park, NY
- Population (ZIP)
- 7,069
Population outlook (Rensselaer County) Hauer SSP2
- Today (2025)
- 162,400 people
- By 2030
- 161,746 · -0.4%
- By 2040
- 158,095 · -2.7%
- By 2050
- 152,966 · -5.8%
- By 2075
- 140,767 · -13.3%
- By 2100
- 124,727 · -23.2%
Race, ethnicity, and origin ACS 2023
- Neighborhood character
- Predominantly White (95%)
- Race & ethnicity
- White 95% Two or more races 4% Hispanic / Latino 3%
- Common ancestry
- Romanian 5% Lithuanian 4% Italian 4%
- Foreign-born
- 5% · Canada
- Languages at home
- 93% English-only · Other Indo-European 4% French/Haitian/Cajun 1% Russian/Polish/Slavic 1%
Political lean MEDSL · Rensselaer
- 2024 margin
- Toss-up / Even · D 50.7% · R 49.3%
- 2008→2024 swing
- -8.0pp toward R · 2008: 9.3pp · 2024: 1.4pp
- All cycles
- 2024: D+1.4 2020: D+5.6 2016: R+2.9 2012: D+11.8 2008: D+9.3
Not yet ingested
- Civics
- —
Market trends
- HPI YoY
- ▲ 11.43%
- Current HPI
- 263.2196
- Rent YoY
- —
- Metro
- —
- State GDP YoY
- ▲ 2.60%
- F500 in state
- 92
Industry mix (Fortune 500 HQ in NY)
| Industry | F500 HQs | Revenue |
|---|---|---|
| Financial Services | 10 | $950B |
|
||
| Consumer Goods | 9 | $162B |
|
||
| Insurance | 4 | $225B |
|
||
| Telecommunications | 2 | $144B |
|
||
| Pharmaceuticals | 2 | $112B |
|
||
| Media / Entertainment | 2 | $69B |
|
||
Price history
+301.6% since first listed21 events — show timeline
- 2026-06-16 Listed $315,000 Global MLS
- 2025-02-06 Sold (Public Records) $281,000 Public Records
- 2025-01-27 Sold (MLS) $281,000 Global MLS
- 2024-12-10 Pending — Global MLS
- 2024-12-06 Listed $250,000 Global MLS
- 2022-09-14 Listing Removed — Global MLS
- 2022-08-31 Price Changed $109,000 Global MLS
- 2022-08-18 Price Changed $129,000 Global MLS
- 2022-08-01 Price Changed $139,000 Global MLS
- 2022-07-25 Listed $149,000 Global MLS
- 2019-05-19 Listing Removed — Global MLS
- 2018-05-18 Listed $183,500 Global MLS
- 2005-12-22 Sold (Public Records) $147,000 Public Records
- 2005-12-16 Sold (MLS) $140,000 Global MLS
- 2005-10-11 Listing Removed — Global MLS
- 2005-10-03 Listed $149,900 Global MLS
- 2000-12-28 Sold (Public Records) $65,950 Public Records
- 2000-12-27 Sold (MLS) $65,950 Global MLS
- 2000-10-25 Listing Removed — Global MLS
- 2000-10-05 Listed $68,000 Global MLS
- 1999-03-24 Sold (Public Records) $78,440 Public Records
Property tax history
+4.0%/yrLatest (2025): $5,681 · -32.3% YoY. Source: county tax records.
Cash-flow waterfall
monthlySold comps — $/sqft
last 12 mo · ≤1 miLoading sold comps…