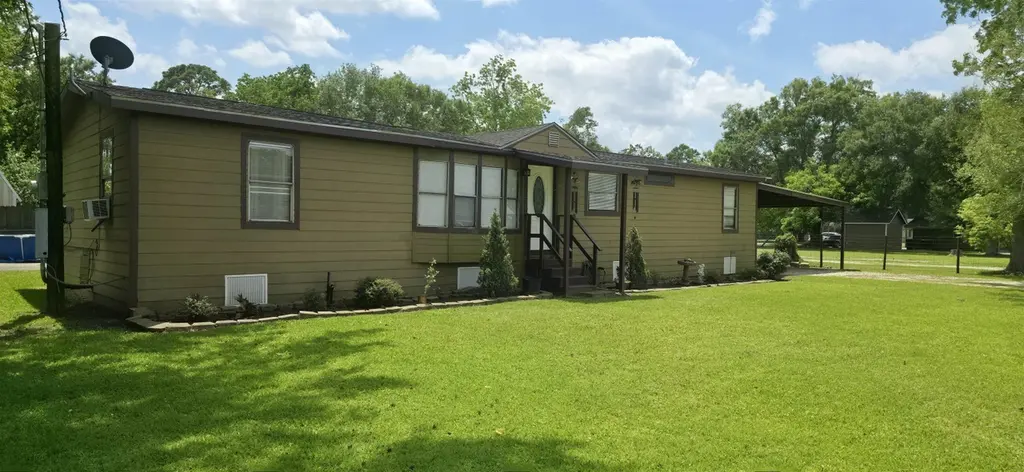
8475 Old Highway 90
Orange, TX 77630
$149,000D
3 bd · 2.0 ba ·
1,320 sqft ·
Built 2014
· Manufactured
· Active
· 45 DOM
Cashflow @ list (25.0% down · 7.5%)
Estimated rent
$1,104/mo
Mortgage (P&I)
−$781
Tax + insurance
−$186
HOA
−$0
Vac / Maint / Mgmt
−$232
Net cashflow
$-96/mo
Annual
$-1,149/yr
Cap rate
5.52%
Cash-on-cash
-2.75%
DSCR
0.88
1% rule
0.74%
Cash to close
$41,720
Investor read
- This is a 3-bed/2.0-bath manufactured listed at $149k.
- At list price, monthly cash flow is $-96 ($-1k/yr) — negative.
- To cash-flow at today's rent, offer at most $132k (11.3% below list).
- To meet the 1% rule (rent ≥ 1% of price), the offer needs to be $110k (25.9% below list).
- It's been on market 45 days — a 3% lower offer ($145k) is reasonable based on typical stale-listing flexibility.
- Recommended offer: $110k (25.9% below list) — sets the bar for 1% rule.
- In year one you build about $3k of equity ($1k loan paydown + $2k appreciation (1.0% local appreciation)).
- Location reads 71/100 on livability (#286 in TX) — a middle-class / working-renter tenant base. Strengths: cost of living A+, housing A+, health & safety A+; Watch: crime D+, employment D+, amenities F.
- Orangefield ISD (rural): math 44% / reading 48% proficiency, ranked #217 of 826 in TX (top 26%) — families likely to look elsewhere, expect single-tenant / working-renter base with shorter leases.
- Zoned schools: Orangefield El (math 44% / reading 44%, grade F, #1,243 of 4,322 statewide, top 29%, 873 students, 39% FRL); Orangefield J H (math 42% / reading 48%, grade D, #479 of 1,662 statewide, top 29%, 434 students, 34% FRL); Orangefield H S (math 52% / reading 57%, grade C-, #379 of 1,632 statewide, top 26%, 549 students, 35% FRL) — zoned schools at 36% FRL track the district average.
- Market conditions: Rents rising fast (+5.7%/yr); 338 active listings in the ZIP; 235 units permitted in Orange County in 2024 (50 in 5+ unit buildings).
- Orange County population projected at +6% by 2050 — modest demand growth; plan on rents tracking national, not racing it.
- Climate carrying-cost: severe wind risk, 99% chance of damaging wind over 30y; extreme-heat days projected 7→23/yr by 2055 (HVAC capex compounding) — expect insurance premiums to compound above CPI over the hold.
- Cap rate 5.5% vs local median 3.8% in Orange — top-decile yield for the area; either an underpriced asset or a hidden risk that comps aren't pricing in. Stress-test before assuming the spread holds.
Questions for listing agent
- What do current leases actually rent for vs. the listed asking? Can we see a recent rent roll and the last 12 months of T-12 income?
- It's been on market 45 days. Have you received any prior offers? Is the seller open to a 26% concession, seller financing, or rate buy-down credit?
- Is there a deadline driving the sale (1031 exchange, divorce, estate, relocation)? That informs how much negotiation room exists.
- Schools are D-rated, which usually means shorter tenancies and higher turnover. Who's the typical renter profile here, and what's been the actual vacancy rate?
- Crime grade is D in this area — have there been break-ins, vandalism, or insurance claims at this property in the last 3 years? What carrier currently insures it and at what premium?
- The area grade is low — what's the realistic commute time and amenity access for the typical tenant pool here? Any planned neighborhood developments (good or bad) we should know about?
- What's the average days-on-market for RENTAL listings here right now (not sales)? A rising rental-DOM trend means longer vacancies and softer asking-rent achievability than the comps imply.
- What's the recent tenant-quality profile in this submarket — average credit score on applications, eviction rate, late-payment / NSF rate, and stable-employment percentage? A property-management company in the area should have these aggregated.
CashFlowRE · CFR-T9QNJT2HQTCQ3G
· Data 9 h ago
cashflowre.app · 2026-05-29