8475 Old Highway 90 · Orange, TX
Flood risk 4/10 · Minor
- FEMA flood zone
- X (unshaded)
- Chance of flooding over 30 yrs
- 0.13%
- Est. flood insurance / yr
- $507 – $1,088
Fire risk 3/10 · Minor
- Est. fire insurance / yr
- $1,222 – $2,270
Heat risk 9/10 · Severe
- Hot days now (above 108°F)
- 7 days/yr
- Hot days in 30 yrs
- 23 days/yr
Wind risk 9/10 · Severe
- Chance of severe wind over 30 yrs
- 99.0%
Air-quality risk 2/10 · Minimal
- Unhealthy air days now
- 1 days/yr
- Unhealthy air days in 30 yrs
- 1 days/yr
Risk factors via First Street. Map © Google.
Why this score? — see what drove the D grade
The composite is a weighted blend of 9 inputs, each scored 0–100. Each bar is that input's sub-score; the figure is the points it added to the 100-point composite (weight × sub-score).
- Cash flow +9.8/30.0
- ARV discount +7.5/15.0
- Appreciation +5.5/10.0
- Schools +4.1/10.0
- Rent growth +3.9/5.0
- Livability +3.6/5.0
- DSCR +2.8/10.0
- Condition / age +2.5/5.0
- 1% rule +2.4/10.0
$149,000
🖨 Deal sheet (PDF) 📄 Offer letter ✓ Due diligence
Listing remarks
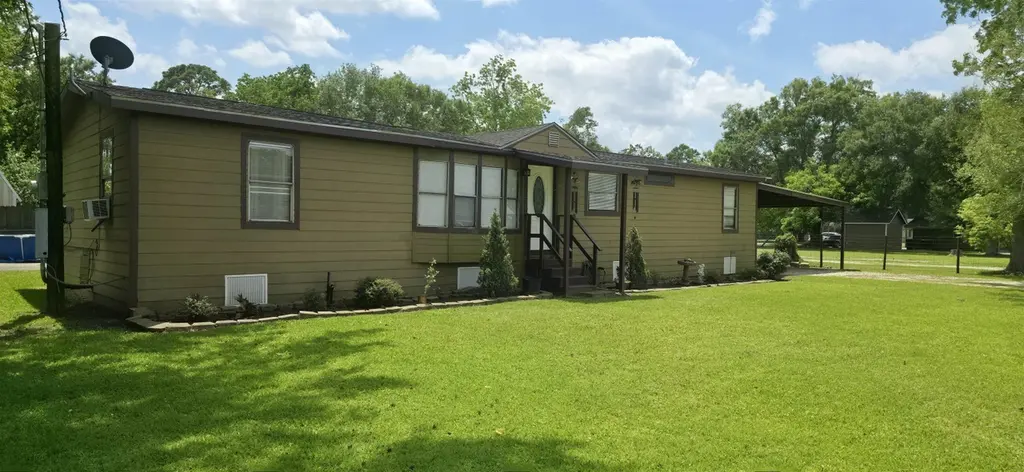
Charming manufactured home situated within the desirable Orangefield ISD. This property boasts 3 bedrooms, 2 full baths, and a carport for 2 vehicles. Enjoy the warmth of a cozy fireplace in the spacious 1,320 sq. ft. interior. The home was completely rebuilt in 2014, and appliances are included for your convenience.
Key facts
- Completely rebuilt
- Appliances included
- Cozy fireplace
Tags
Property features AI
Exterior
- Parking: Carport with 2 spaces
- Utilities: Public water; Public sewer
- Home design: Residential mobile home; Mobile home with land; Property faces unspecified
- Construction: Composition roof
- Exterior features: Chain link fencing; Storage structure
Interior
- Kitchen: Refrigerator; Range
- Bathrooms: 2 full bathrooms
- Heating & cooling: Ceiling fan(s); Window unit(s)
- Interior features: Wood-burning fireplace; Storm door(s)
Neighborhood map
What this means for you Summary
Snapshot
- This is a 3-bed/2.0-bath manufactured listed at $149k.
Deal economics
- At list price, monthly cash flow is $-96 ($-1k/yr) — negative.
- To cash-flow at today's rent, offer at most $132k (11.3% below list).
- To meet the 1% rule (rent ≥ 1% of price), the offer needs to be $110k (25.9% below list).
- Recommended offer: $110k (25.9% below list) — sets the bar for 1% rule.
- Cap rate 5.5% vs local median 3.8% in Orange — top-decile yield for the area; either an underpriced asset or a hidden risk that comps aren't pricing in. Stress-test before assuming the spread holds.
Location & tenants
- Location reads 71/100 on livability (#286 in TX) — a middle-class / working-renter tenant base. Strengths: cost of living A+, housing A+, health & safety A+; Watch: crime D+, employment D+, amenities F.
- Orangefield ISD (rural): math 44% / reading 48% proficiency, ranked #217 of 826 in TX (top 26%) — families likely to look elsewhere, expect single-tenant / working-renter base with shorter leases.
- Zoned schools: Orangefield El (math 44% / reading 44%, grade F, #1,243 of 4,322 statewide, top 29%, 873 students, 39% FRL); Orangefield J H (math 42% / reading 48%, grade D, #479 of 1,662 statewide, top 29%, 434 students, 34% FRL); Orangefield H S (math 52% / reading 57%, grade C-, #379 of 1,632 statewide, top 26%, 549 students, 35% FRL) — zoned schools at 36% FRL track the district average.
- Market conditions: Rents rising fast (+5.7%/yr); 338 active listings in the ZIP; 235 units permitted in Orange County in 2024 (50 in 5+ unit buildings).
Forward outlook
- In year one you build about $3k of equity ($1k loan paydown + $2k appreciation (1.0% local appreciation)).
- Orange County population projected at +6% by 2050 — modest demand growth; plan on rents tracking national, not racing it.
Negotiation context
- It's been on market 45 days — a 3% lower offer ($145k) is reasonable based on typical stale-listing flexibility.
Risks & watch-outs
- Climate carrying-cost: severe wind risk, 99% chance of damaging wind over 30y; extreme-heat days projected 7→23/yr by 2055 (HVAC capex compounding) — expect insurance premiums to compound above CPI over the hold.
Questions for the listing agent
- What do current leases actually rent for vs. the listed asking? Can we see a recent rent roll and the last 12 months of T-12 income?
- It's been on market 45 days. Have you received any prior offers? Is the seller open to a 26% concession, seller financing, or rate buy-down credit?
- Is there a deadline driving the sale (1031 exchange, divorce, estate, relocation)? That informs how much negotiation room exists.
- Schools are D-rated, which usually means shorter tenancies and higher turnover. Who's the typical renter profile here, and what's been the actual vacancy rate?
- Crime grade is D in this area — have there been break-ins, vandalism, or insurance claims at this property in the last 3 years? What carrier currently insures it and at what premium?
- The area grade is low — what's the realistic commute time and amenity access for the typical tenant pool here? Any planned neighborhood developments (good or bad) we should know about?
- What's the average days-on-market for RENTAL listings here right now (not sales)? A rising rental-DOM trend means longer vacancies and softer asking-rent achievability than the comps imply.
- What's the recent tenant-quality profile in this submarket — average credit score on applications, eviction rate, late-payment / NSF rate, and stable-employment percentage? A property-management company in the area should have these aggregated.
- How much new for-sale + rental construction is in the pipeline within 1–3 miles? Heavy new supply typically softens prices + rents 12–24 months out; constrained supply supports both.
Investment metrics
- 1% rule
- 0.74% ✗
- Cap rate
- 5.52%
- Cash-on-cash
- -2.75%
- DSCR
- 0.88
- GRM
- 11.2
CMA / ARV
No comps found within radius.
Projected returns pro-forma
1.01% appreciation · 5.71% rent growth · sell at horizon
- IRR
- -0.1%
- Equity multiple
- 1.00×
- Total profit
- $-168
- Equity at exit
- $50,943
- IRR
- 6.2%
- Equity multiple
- 1.80×
- Total profit
- $33,398
- Equity at exit
- $67,758
Cash invested: $41,720 (down + closing). Projections, not guarantees.
Landlord ↔ Tenant lean methodology
- Overall (STATE)
- 87 Strongly Landlord-Friendly
- State Texas
- 87 Strongly Landlord-Friendly · R+5
- County
- — inherits STATE
- City
- — inherits STATE
ZIP-level market 77630
- Home prices YoY
- 0.4%
- Rents YoY
- 5.7%
- Active inventory
- 338
- Price-to-rent
- 11.2×
Monthly cashflow live
- Estimated rent
- $1,104 medium interval (Pro) →
- Mortgage (P&I)
- −$781
- Tax from tax record
- −$124 /mo · $1,493/yr
- Insurance
- −$62
- HOA
- −$0
- Lot rent leased land?
- −$0
- Vacancy / Maint / Mgmt
- −$232
- Net cashflow
- $-96
Break-even live
Sensitivity live
| Price | -10% $-11 | -5% $-54 | +0% $-96 | +5% $-138 | +10% $-180 |
|---|---|---|---|---|---|
| Rent | -10% $-183 | -5% $-139 | +0% $-96 | +5% $-52 | +10% $-9 |
| Rate | -1.0pp $-21 | -0.5pp $-58 | base $-96 | +0.5pp $-134 | +1.0pp $-174 |
UW: 25.0% down · 7.5% · 30yr · 1.5% tax · 5.0% vac · 8.0% maint · 8.0% mgmt
Financing live
Cash to close
- Down payment
- $37,250
- Closing costs
- $4,470
- Reserves months
- —
- Total cash needed
- —
Loan-product check · same deal, 3 products live
Conventional
25% down · 7.5% · 30yr
- Down + closing
- —
- Monthly P&I
- —
- Monthly cashflow
- —
- DSCR
- —
- Eligible?
- —
Personal DTI + credit; lowest rate.
DSCR
20% down · 8.5% · 30yr
- Down + closing
- —
- Monthly P&I
- —
- Monthly cashflow
- —
- DSCR
- —
- Eligible?
- —
No personal income docs; deal must DSCR.
Hard money
10% down · 12.0% · 12mo
- Down + closing
- —
- Monthly P&I
- —
- Monthly cashflow
- —
- DSCR
- —
- Eligible?
- —
Short-term bridge; refi at stabilization.
Listing history 23 events
-
2026-06-23days on market $149,000 Active 45 DOM
-
2026-06-21days on market $149,000 Active 44 DOM
-
2026-06-18price $149,000 Active 41 DOM
-
2026-06-18days on market $156,000 Active 41 DOM
-
2026-06-17days on market $156,000 Active 40 DOM
-
2026-06-16days on market $156,000 Active 39 DOM
-
2026-06-15days on market $156,000 Active 38 DOM
-
2026-06-14days on market $156,000 Active 36 DOM
-
2026-06-13days on market $156,000 Active 35 DOM
-
2026-06-10days on market $156,000 Active 33 DOM
-
2026-06-09days on market $156,000 Active 32 DOM
-
2026-06-08days on market $156,000 Active 31 DOM
-
2026-06-07days on market $156,000 Active 30 DOM
-
2026-06-03days on market $156,000 Active 26 DOM
-
2026-06-02days on market $156,000 Active 25 DOM
-
2026-06-01days on market $156,000 Active 24 DOM
-
2026-05-31days on market $156,000 Active 23 DOM
-
2026-05-30days on market $156,000 Active 22 DOM
-
2026-05-08$156,000 Active 318-char remark
-
2019-01-29soldstatus
-
2014-02-05soldstatus
-
2012-03-06soldstatus
-
2012-02-29soldstatus
ⓘ Source: listings_history table (triggers on properties + properties_extension) + one-shot
backfill from property_details.listing_events for pre-trigger history.
Tax reassessment forecast TX · Resets to sale price
- Current annual tax
- $1,493 · $124/mo
- Projected year-2 tax
- $2,727 · $227/mo
- Expected delta
- +$1,234/yr (+$103/mo · 82.6%)
ⓘ Screening estimate from a state-policy table — verify with the county assessor before closing.
Climate risk First Street
- Flood 4/10 Moderate FEMA zone X (unshaded) · 13% chance over 30 yrs
- Wildfire 3/10 Moderate
- Heat 9/10 Extreme 7 d/yr ≥108°F today · 23 d/yr by 30 yrs out
- Wind 9/10 Extreme 99% chance of damaging wind over 30 yrs
- Air quality 2/10 Low 1 unhealthy d/yr today · 1 by 30 yrs out
Nearby sold comps map
Loading sold comps map…
Walkable amenities ~0.75 mi
Loading nearby amenities…
Taxation est. · year 1
- Rental income
- $13,248
- − Mortgage interest
- −$8,346
- − Property taxes
- −$1,493
- − Insurance
- −$745
- − Repairs & maintenance
- −$1,060
- − Management
- −$1,060
- − Depreciation
- −$4,335
- Taxable loss
- −$3,791
- Est. tax savings @ 24.0%
- +$910
- After-tax cash flow
- $-239/yr
For passive investors: Depreciation is non-cash, so a rental often shows a tax loss while cash-flowing — sheltering income. Rental losses are passive: they offset passive income freely, and up to $25,000/yr can offset ordinary (W-2) income if you actively participate and your MAGI is under $100k (phasing out to $0 by $150k); unused losses carry forward. On sale, claimed depreciation is recaptured at up to 25%, and gains may owe capital-gains tax (a 1031 exchange can defer both). Figures are a year-1 estimate at your 24.0% rate — not tax advice; consult a CPA.
Schools (NCES district)
- District
- Orangefield ISD
- NCES district ID
- 4833780
- Math proficiency
- 44% ▬ 0.00%
- Reading proficiency
- 48% ▬ 0.00%
- Median HH income
- $63,682
- Composite
- 40.77/100
- National rank
- #3647
- State rank
- #217 of 826 in TX
Livability — Orange
- Score
- 71/100
- State rank
- #286
- US rank
- #6456
Category grades
Schools grade is shown separately in the Schools card above.
Census & demographics
- County
- Orange County · 87,112 people
- City population
- 22,976
- Metro
- Beaumont-Port Arthur, TX
- Population (ZIP)
- 28,983
- Household income
- $64,373
- Rent vs Own
- Severe rent burden
- 1018.0
Population outlook (Orange County) Hauer SSP2
- Today (2025)
- 88,065 people
- By 2030
- 89,591 · +1.7%
- By 2040
- 91,982 · +4.4%
- By 2050
- 93,023 · +5.6%
- By 2075
- 94,871 · +7.7%
- By 2100
- 88,155 · +0.1%
Race, ethnicity, and origin ACS 2023
- Neighborhood character
- Majority White (64%)
- Race & ethnicity
- White 64% Black 21% Hispanic / Latino 11% Two or more races 9%
- Hispanic origin (detail)
- Mexican 7%
- Common ancestry
- Lithuanian 13% Italian 1% Slovak 1%
- Foreign-born
- 5% · Canada
- Languages at home
- 91% English-only · Spanish 7% French/Haitian/Cajun 1% Other Asian/Pacific 1%
Political lean MEDSL · Orange
- 2024 margin
- Solid R (+66.8) · D 16.4% · R 83.1%
- 2008→2024 swing
- -19.6pp toward R · 2008: -47.1pp · 2024: -66.8pp
- All cycles
- 2024: R+66.8 2020: R+63.4 2016: R+61.9 2012: R+54.3 2008: R+47.1
Not yet ingested
- Civics
- —
Market trends
- HPI YoY
- ▲ 1.01%
- Current HPI
- 264.14
- Rent YoY
- ▲ 5.71%
- Metro
- Beaumont-Port Arthur, TX
- State GDP YoY
- ▲ 3.95%
- F500 in state
- 110
Industry mix (Fortune 500 HQ in TX)
| Industry | F500 HQs | Revenue |
|---|---|---|
| Energy | 16 | $1,198B |
|
||
| Technology | 5 | $198B |
|
||
| Engineering / Construction | 4 | $72B |
|
||
| Energy Services | 3 | $60B |
|
||
| Utilities | 3 | $41B |
|
||
| Healthcare | 2 | $330B |
|
||
Price history
5 events — show timeline
- 2026-05-08 Listed $156,000 BBOR
- 2019-01-29 Sold (Public Records) — Public Records
- 2014-02-05 Sold (Public Records) — Public Records
- 2012-03-06 Sold (Public Records) — Public Records
- 2012-02-29 Sold (Public Records) — Public Records
Property tax history
+4.5%/yrLatest (2025): $1,493 · -4.1% YoY. Source: county tax records.
Cash-flow waterfall
monthlySold comps — $/sqft
last 12 mo · ≤1 miLoading sold comps…