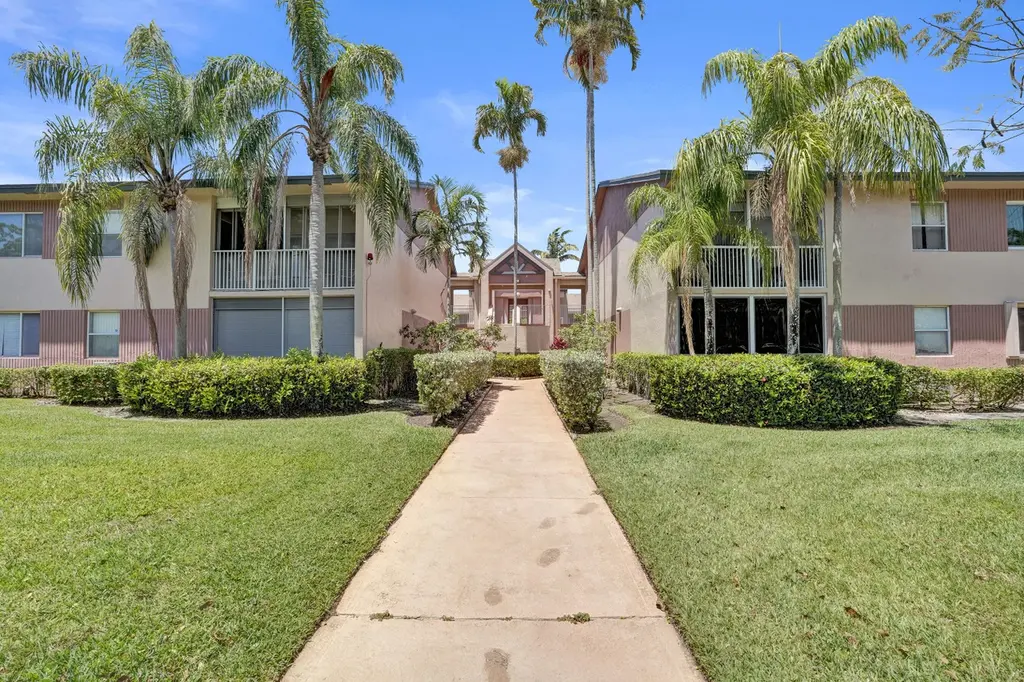
7243 S Devon Dr
Tamarac, FL 33321
$165,000D
2 bd · 2.0 ba ·
1,325 sqft ·
Built 1990
· Condo
· Active
· 41 DOM
Cashflow @ list (25.0% down · 7.5%)
Estimated rent
$2,240/mo
Mortgage (P&I)
−$865
Tax + insurance
−$275
HOA
−$774
Vac / Maint / Mgmt
−$470
Net cashflow
$-145/mo
Annual
$-1,739/yr
Cap rate
5.24%
Cash-on-cash
-3.76%
DSCR
0.83
1% rule
1.36%
Cash to close
$46,200
Investor read
- This is a 2-bed/2.0-bath condo listed at $165k. Condition is rated good.
- At list price, monthly cash flow is $-145 ($-2k/yr) — negative.
- To cash-flow at today's rent, offer at most $144k (12.7% below list).
- Meets the 1% rule at list price ($2k rent vs $165k).
- It's been on market 41 days — a 3% lower offer ($160k) is reasonable based on typical stale-listing flexibility.
- Recommended offer: $144k (12.7% below list) — sets the bar for cash-flow.
- Local home prices are declining (-3.0%/yr); year-one equity from $1k of loan paydown is wiped out by about $5k of value loss. Plan a longer hold.
- Location reads 76/100 on livability (#239 in FL, #3,785 nationally) — a middle-class / working-renter tenant base. Strengths: housing A+, health & safety A+, cost of living A-; Watch: employment C-, amenities F, commute F.
- Broward (suburban): math 42% / reading 53% proficiency, ranked #46 of 73 in FL (top 63%) — families likely to look elsewhere, expect single-tenant / working-renter base with shorter leases.
- Zoned schools: Challenger Elementary School (math 37% / reading 53%, grade D-, #1,271 of 2,144 statewide, top 60%, 909 students, 62% FRL); J. P. Taravella High School (math 19% / reading 45%, grade F, #415 of 667 statewide, top 63%, 2,586 students, 54% FRL).
- Watch-outs: HOA is 35% of rent.
- Market conditions: Rents soft (-1.9%/yr); 588 active listings in the ZIP; 40 comparable units currently listed for rent nearby; rentals at typical pace (median 24d on market — plan ~3-4 weeks tenant-placement turnaround); 2,111 units permitted in Broward County in 2024 (1,265 in 5+ unit buildings).
- Broward County population projected at +34% by 2050 — long-run rental-demand tailwind backs the buy-and-hold thesis.
- Cap rate 5.2% vs local median 3.9% in Tamarac — top-decile yield for the area; either an underpriced asset or a hidden risk that comps aren't pricing in. Stress-test before assuming the spread holds.
- This rent runs 43% of the median local income ($62k/yr) — at the standard rent-burdened threshold; future hikes will face affordability resistance.
Questions for listing agent
- What do current leases actually rent for vs. the listed asking? Can we see a recent rent roll and the last 12 months of T-12 income?
- It's been on market 41 days. Have you received any prior offers? Is the seller open to a 13% concession, seller financing, or rate buy-down credit?
- What does the HOA fee cover, when was the last increase, and are there any pending special assessments or reserve-fund shortfalls?
- Any open or pending special assessments — roof, HVAC, plumbing, elevator, façade? What's the per-unit balance and payoff schedule, and is the seller paying it off at close or rolling it to the buyer?
- Is there a deadline driving the sale (1031 exchange, divorce, estate, relocation)? That informs how much negotiation room exists.
- Schools are B-rated — typically a magnet for longer-tenancy family renters. What's the average tenant stay here, and is there a school-zone premium baked into asking?
- The area grade is low — what's the realistic commute time and amenity access for the typical tenant pool here? Any planned neighborhood developments (good or bad) we should know about?
- What's the average days-on-market for RENTAL listings here right now (not sales)? A rising rental-DOM trend means longer vacancies and softer asking-rent achievability than the comps imply.
CashFlowRE · CFR-TCHF7W80RGPH7A
· Data 2 days ago
cashflowre.app · 2026-05-29