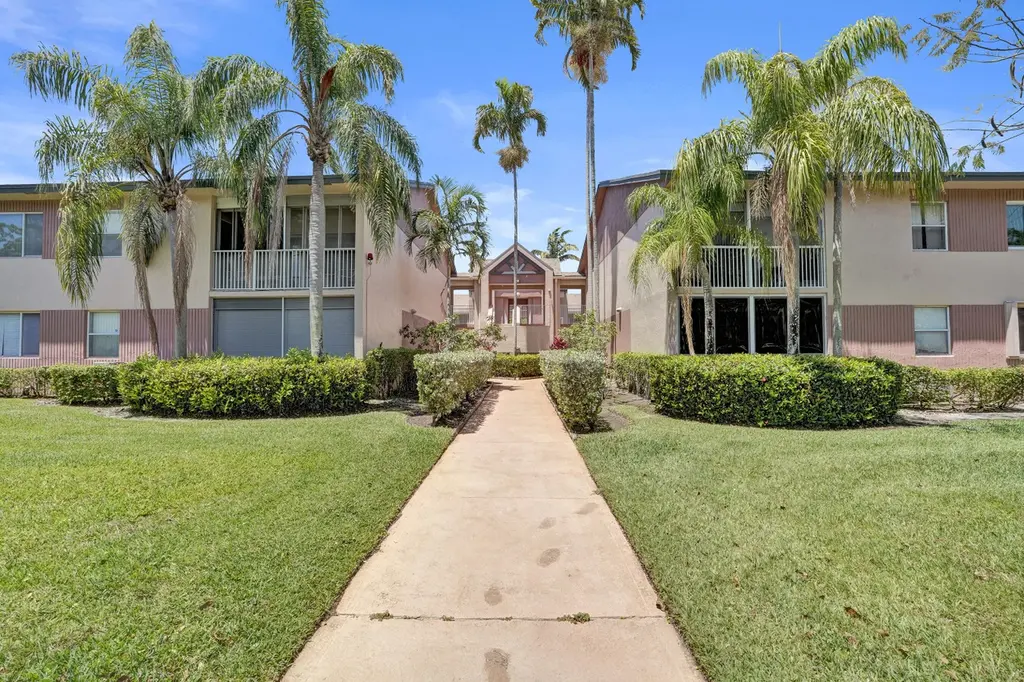
7243 S Devon Dr · Tamarac, FL
Flood risk No data
- FEMA flood zone
- —
- Chance of flooding over 30 yrs
- —
- Est. flood insurance / yr
- —
Fire risk No data
- Est. fire insurance / yr
- —
Heat risk No data
- Hot days now (above threshold)
- —
- Hot days in 30 yrs
- —
Wind risk No data
- Chance of severe wind over 30 yrs
- —
Air-quality risk No data
- Unhealthy air days now
- —
- Unhealthy air days in 30 yrs
- —
Risk factors via First Street. Map © Google.
Why this score? — see what drove the D grade
The composite is a weighted blend of 9 inputs, each scored 0–100. Each bar is that input's sub-score; the figure is the points it added to the 100-point composite (weight × sub-score).
- 1% rule +8.6/10.0
- Cash flow +8.5/30.0
- ARV discount +7.5/15.0
- Schools +4.1/10.0
- Livability +3.8/5.0
- Condition / age +3.8/5.0
- DSCR +2.3/10.0
- Rent growth +2.0/5.0
- Appreciation +0.0/10.0
$165,000
🖨 Deal sheet 📄 Offer letter ✓ Due diligence
Listing remarks
Lovely corner 2 Bed/ 2 Bath water views in the highly sought after Kings Point community. This spacious residence features vaulted ceilings, an open floor plan, and lots natural light. Enjoy two private screened in patios perfect for relaxing outdoors, plus a larger patio with a convenient storage closet and tranquil water views. The oversized eat-in kitchen offers plenty of space for dining and entertaining. Additional features include a walk-in closet, in-unit washer and dryer, and elevator building access. Kings Point is an active 55+ community offering resort-style amenities including a 60,000 sq. ft. clubhouse, 1,000-seat theater, multiple pools, fitness center, billiards, hobby rooms,
Key facts
- Larger patio
- Walk-in closet
- $774 HOA
Tags
Property features AI
Finance
- Other: Senior community
- HOA & community: Part of Kings Point association; Monthly HOA fee; HOA amenities include clubhouse, fitness center, indoor pool, heated pool, tennis courts, pickleball and shuffleboard courts, basketball court, billiard and game rooms, library, workshop area, hobby room, community room, courtesy bus, maintained community, sidewalks and street lights, gated entry, security, parking, pool service and recreation facilities; Association fees cover cable TV, insurance, internet, structure maintenance, pest control, sewer, trash, water, elevator, reserve funds, roof repairs, recreation facilities and common area maintenance
Exterior
- Parking: Assigned parking with shared driveway and guest spaces; Asphalt parking; Total of 1 parking space
- Security: Fire alarm; Smoke detectors; Entry phone/intercom; Gated community
- Utilities: Public water; Public sewer; Electricity connected; Cable available; Water available; Sewer connected
- Home design: Condominium; One level; Entry on level 1; Faces northwest
- Construction: Built with stucco and concrete block (CBS); Flat tar/gravel roof; Part of a 2-story building
- Exterior features: Gated community (no guard); Gate and fenced area; Private maintained asphalt road; City street frontage; Not waterfront
Interior
- Kitchen: Dishwasher; Disposal; Electric range and electric cooktop; Microwave; Refrigerator; Freezer; Electric water heater
- Bedrooms: Main level bedroom(s)
- Flooring: Tile flooring
- Bathrooms: 2 full bathrooms
- Heating & cooling: Electric heating with radiant and central individual systems; Central air conditioning with ceiling fans
- Interior features: High ceilings with vaulted areas; Walk-in closet(s); Blinds, sliding and shutter window treatments
- Laundry & utility: In-unit laundry (laundry closet, laundry room, inside, in kitchen)
Neighborhood map
What this means for you Summary
Snapshot
- This is a 2-bed/2.0-bath condo listed at $165k. Condition is rated good.
Deal economics
- At list price, monthly cash flow is $-145 ($-2k/yr) — negative.
- To cash-flow at today's rent, offer at most $144k (12.7% below list).
- Meets the 1% rule at list price ($2k rent vs $165k).
- Recommended offer: $144k (12.7% below list) — sets the bar for cash-flow.
- Cap rate 5.2% vs local median 3.9% in Tamarac — top-decile yield for the area; either an underpriced asset or a hidden risk that comps aren't pricing in. Stress-test before assuming the spread holds.
Location & tenants
- Location reads 76/100 on livability (#239 in FL, #3,785 nationally) — a middle-class / working-renter tenant base. Strengths: housing A+, health & safety A+, cost of living A-; Watch: employment C-, amenities F, commute F.
- Broward (suburban): math 42% / reading 53% proficiency, ranked #46 of 73 in FL (top 63%) — families likely to look elsewhere, expect single-tenant / working-renter base with shorter leases.
- Zoned schools: Challenger Elementary School (math 37% / reading 53%, grade D-, #1,271 of 2,144 statewide, top 60%, 909 students, 62% FRL); J. P. Taravella High School (math 19% / reading 45%, grade F, #415 of 667 statewide, top 63%, 2,586 students, 54% FRL).
- Market conditions: Rents soft (-1.9%/yr); 588 active listings in the ZIP; 40 comparable units currently listed for rent nearby; rentals at typical pace (median 24d on market — plan ~3-4 weeks tenant-placement turnaround); 2,111 units permitted in Broward County in 2024 (1,265 in 5+ unit buildings).
- This rent runs 43% of the median local income ($62k/yr) — at the standard rent-burdened threshold; future hikes will face affordability resistance.
Forward outlook
- Local home prices are declining (-3.0%/yr); year-one equity from $1k of loan paydown is wiped out by about $5k of value loss. Plan a longer hold.
- Broward County population projected at +34% by 2050 — long-run rental-demand tailwind backs the buy-and-hold thesis.
Negotiation context
- It's been on market 41 days — a 3% lower offer ($160k) is reasonable based on typical stale-listing flexibility.
Risks & watch-outs
- Watch-outs: HOA is 35% of rent.
Questions for the listing agent
- What do current leases actually rent for vs. the listed asking? Can we see a recent rent roll and the last 12 months of T-12 income?
- It's been on market 41 days. Have you received any prior offers? Is the seller open to a 13% concession, seller financing, or rate buy-down credit?
- What does the HOA fee cover, when was the last increase, and are there any pending special assessments or reserve-fund shortfalls?
- Any open or pending special assessments — roof, HVAC, plumbing, elevator, façade? What's the per-unit balance and payoff schedule, and is the seller paying it off at close or rolling it to the buyer?
- Is there a deadline driving the sale (1031 exchange, divorce, estate, relocation)? That informs how much negotiation room exists.
- Schools are B-rated — typically a magnet for longer-tenancy family renters. What's the average tenant stay here, and is there a school-zone premium baked into asking?
- The area grade is low — what's the realistic commute time and amenity access for the typical tenant pool here? Any planned neighborhood developments (good or bad) we should know about?
- What's the average days-on-market for RENTAL listings here right now (not sales)? A rising rental-DOM trend means longer vacancies and softer asking-rent achievability than the comps imply.
- What's the recent tenant-quality profile in this submarket — average credit score on applications, eviction rate, late-payment / NSF rate, and stable-employment percentage? A property-management company in the area should have these aggregated.
- How much new apartment / multifamily construction is in the pipeline within 1–3 miles? Heavy new supply (>2% of stock underway) typically softens rents 12–24 months out; light construction supports rent growth.
Investment metrics
- 1% rule
- 1.36% ✓
- Cap rate
- 5.24%
- Cash-on-cash
- -3.76%
- DSCR
- 0.83
- GRM
- 6.1
CMA / ARV
No comps found within radius.
Projected returns pro-forma
-3.0% appreciation · 0.0% rent growth · sell at horizon
- IRR
- -28.4%
- Equity multiple
- 0.09×
- Total profit
- $-42,019
- Equity at exit
- $24,602
- IRR
- -67.3%
- Equity multiple
- -0.55×
- Total profit
- $-71,768
- Equity at exit
- $14,266
Cash invested: $46,200 (down + closing). Projections, not guarantees.
Landlord ↔ Tenant lean methodology
- Overall (STATE)
- 87 Strongly Landlord-Friendly
- State Florida
- 87 Strongly Landlord-Friendly · R+3
- County
- — inherits STATE
- City
- — inherits STATE
ZIP-level market 33321
- Home prices YoY
- -30.4%
- Rents YoY
- -1.9%
- Active inventory
- 588
- Price-to-rent
- 6.1×
Monthly cashflow live
- Estimated rent
- $2,240 high interval (Pro) →
- Mortgage (P&I)
- −$865
- Tax est. 1.5%
- −$206 /mo · $2,475/yr
- Insurance
- −$69
- HOA
- −$774
- Vacancy / Maint / Mgmt
- −$470
- Net cashflow
- $-145
Break-even live
UW: 25.0% down · 7.5% · 30yr · 1.5% tax · 5.0% vac · 8.0% maint · 8.0% mgmt
Financing live
Cash to close
- Down payment
- $41,250
- Closing costs
- $4,950
- Reserves months
- —
- Total cash needed
- —
Loan-product check · same deal, 3 products live
Conventional
25% down · 7.5% · 30yr
- Down + closing
- —
- Monthly P&I
- —
- Monthly cashflow
- —
- DSCR
- —
- Eligible?
- —
Personal DTI + credit; lowest rate.
DSCR
20% down · 8.5% · 30yr
- Down + closing
- —
- Monthly P&I
- —
- Monthly cashflow
- —
- DSCR
- —
- Eligible?
- —
No personal income docs; deal must DSCR.
Hard money
10% down · 12.0% · 12mo
- Down + closing
- —
- Monthly P&I
- —
- Monthly cashflow
- —
- DSCR
- —
- Eligible?
- —
Short-term bridge; refi at stabilization.
Rent comps 40 comps
| Address | Beds | Baths | Sqft | Rent | $/sqft | DOM | Units | Dist |
|---|---|---|---|---|---|---|---|---|
| 7271 S Devon Dr #101 Tamarac, FL | 2.0 | 2.0 | 1187 | $2,200 | $1.85 | 22d | 1 | 0.03mi |
| 7214 S Devon Dr #211 Tamarac, FL | 2.0 | 2.0 | 1292 | $2,400 | $1.86 | 24d | 1 | 0.04mi |
| 10959 W Clairmont Cir #211 Tamarac, FL | 2.0 | 2.0 | 1163 | $2,100 | $1.81 | 24d | 1 | 0.17mi |
| 10426 E Clairmont Cir #212 Tamarac, FL | 2.0 | 2.0 | 1294 | $2,100 | $1.62 | 24d | 1 | 0.34mi |
| 10350 E Clairmont Cir #312 Tamarac, FL | 2.0 | 2.0 | 1294 | $2,300 | $1.78 | 24d | 1 | 0.37mi |
| 10881 Sea Hibiscus Ln Tamarac, FL | 3.0 | 2.5 | 1627 | $3,350 | $2.06 | 24d | 1 | 0.39mi |
| 7737 Trent Dr #204 Tamarac, FL | 2.0 | 2.0 | 1080 | $2,000 | $1.85 | 20d | 1 | 0.49mi |
| 7878 Trent Dr #308 Tamarac, FL | 2.0 | 2.0 | 1215 | $2,300 | $1.89 | 24d | 1 | 0.54mi |
| 7878 Trent Dr #308 Tamarac, FL | 2.0 | 2.0 | 1215 | $2,000 | $1.65 | 12d | 1 | 0.54mi |
| 9909 Westwood Dr Unit 23-1 Tamarac, FL | 2.0 | 1.0 | 939 | $1,880 | $2.00 | 24d | 1 | 0.69mi |
| 9909 Westwood Dr Unit 23-1 Tamarac, FL | 2.0 | 1.0 | 939 | $1,870 | $1.99 | 5d | 1 | 0.69mi |
| 9907 Westwood Dr Unit 24-2 Tamarac, FL | 2.0 | 1.0 | 939 | $2,000 | $2.13 | 24d | 1 | 0.71mi |
| 10403 NW 80th Ct Unit 10403 Tamarac, FL | 1.0 | 1.0 | 1688 | $1,995 | $1.18 | 24d | 1 | 0.75mi |
| 7940 N Nob Hill Rd #108 Tamarac, FL | 2.0 | 2.0 | 981 | $2,150 | $2.19 | 24d | 1 | 0.80mi |
| 8000 N Nob Hill Rd #106 Tamarac, FL | 2.0 | 2.0 | 981 | $2,000 | $2.04 | 3d | 1 | 0.81mi |
| 8000 N Nob Hill Rd #206 Tamarac, FL | 2.0 | 2.0 | 981 | $2,190 | $2.23 | 7d | 1 | 0.81mi |
| 8000 N Nob Hill Rd #206 Tamarac, FL | 2.0 | 2.0 | 981 | $2,000 | $2.04 | 5d | 1 | 0.81mi |
| 7950 N Nob Hill Rd #203 Tamarac, FL | 3.0 | 2.0 | 981 | $2,700 | $2.75 | 24d | 1 | 0.82mi |
| 7970 N Nob Hill Rd Tamarac, FL | 1.0–3.0 | 1.0–2.0 | 1137 | $2,195 | $1.93 | 20d | 2 | 0.83mi |
| 7970 N Nob Hill Rd Tamarac, FL | 3.0 | 2.0 | 1137 | $2,475 | $2.18 | 24d | 2 | 0.83mi |
| 7755 Yardley Dr #112 Fort Lauderdale, FL | 2.0 | 2.0 | 1229 | $2,400 | $1.95 | 24d | 1 | 0.83mi |
| 8205 NW 106th Ave Tamarac, FL | 3.0 | 2.0 | 1587 | $3,500 | $2.21 | 5d | 1 | 0.84mi |
| 8320 Santa Monica Ave Unit 8320 Tamarac, FL | 3.0 | 2.5 | 1428 | $2,900 | $2.03 | 4d | 1 | 0.86mi |
| 8020 N Nob Hill Rd Tamarac, FL | 1.0–2.0 | 1.0–2.0 | 981 | $2,180 | $2.22 | 14d | 3 | 0.87mi |
| 7980 N Nob Hill Rd #205 Tamarac, FL | 2.0 | 2.0 | 981 | $2,050 | $2.09 | 24d | 1 | 0.87mi |
| 8030 N Nob Hill Rd #105 Tamarac, FL | 2.0 | 2.0 | 981 | $2,100 | $2.14 | 24d | 1 | 0.87mi |
| 7980 N Nob Hill Rd Tamarac, FL | 1.0–2.0 | 1.0–2.0 | 836 | $2,050 | $2.45 | 16d | 2 | 0.87mi |
| 7765 Yardley Dr #107 Fort Lauderdale, FL | 2.0 | 2.0 | 1469 | $2,200 | $1.50 | 12d | 1 | 0.87mi |
| 9485 N Belfort Cir #308 Tamarac, FL | 2.0 | 2.0 | 1228 | $2,100 | $1.71 | 13d | 1 | 0.88mi |
| 10000 S Nob Hill Cir #10163 Tamarac, FL | 2.0 | 1.0 | 900 | $1,767 | $1.96 | 3d | 1 | 0.90mi |
| 8060 N Nob Hill Rd #203 Tamarac, FL | 2.0 | 2.0 | 981 | $2,200 | $2.24 | 24d | 1 | 0.91mi |
| 8070 N Nob Hill Rd #205 Tamarac, FL | 2.0 | 2.0 | 981 | $1,990 | $2.03 | 24d | 1 | 0.92mi |
| 9920 NW 68th Pl Tamarac, FL | 2.0 | 2.0 | 890 | $1,975 | $2.22 | 24d | 2 | 0.94mi |
| 7304 Westwood Dr Unit 7304 Tamarac, FL | 3.0 | 2.0 | 1524 | $3,900 | $2.56 | 24d | 1 | 0.96mi |
| 9511 Weldon Cir Unit 412 Tamarac, FL | 2.0 | 2.0 | 1080 | $1,875 | $1.74 | 7d | 1 | 0.96mi |
| 9511 Weldon Cir Tamarac, FL | 2.0 | 2.0 | 1116 | $1,850 | $1.66 | 24d | 2 | 0.97mi |
| 8090 NW 96th Ter Tamarac, FL | 1.0–3.0 | 1.0–2.0 | 1154 | $2,498 | $2.16 | 1d | 19 | 1.01mi |
| 7670 Westwood Dr #703 Tamarac, FL | 2.0 | 2.0 | 984 | $1,850 | $1.88 | 24d | 1 | 1.01mi |
| 9560 Weldon Cir Unit J308 Fort Lauderdale, FL | 2.0 | 1.5 | 981 | $1,900 | $1.94 | 2d | 1 | 1.02mi |
| 9560 Weldon Cir Unit J308 Fort Lauderdale, FL | 2.0 | 1.5 | 981 | $1,900 | $1.94 | 24d | 1 | 1.02mi |
HOA detail condo
- Monthly dues
- $774 · $9,288/yr
- Likely covers
- waterpoolgym
- Assessments
- None detected in remarks — confirm with the listing agent.
Listing history 14 events
-
2026-06-18days on market $165,000 Active 41 DOM
-
2026-06-17days on market $165,000 Active 40 DOM
-
2026-06-16days on market $165,000 Active 39 DOM
-
2026-06-15days on market $165,000 Active 38 DOM
-
2026-06-13pricedays on market $165,000 Active 36 DOM
-
2026-06-09days on market $175,000 Active 32 DOM
-
2026-06-08days on market $175,000 Active 31 DOM
-
2026-06-07days on market $175,000 Active 30 DOM
-
2026-06-04statusdays on market $175,000 Active 27 DOM
-
2026-06-03statusdays on market $175,000 Pending 26 DOM
-
2026-06-02days on market $175,000 Active 25 DOM
-
2026-06-01days on market $175,000 Active 24 DOM
-
2026-05-31days on market $175,000 Active 23 DOM
-
2026-05-08$175,000 Active
ⓘ Source: listings_history table (triggers on properties + properties_extension) + one-shot
backfill from property_details.listing_events for pre-trigger history.
Nearby sold comps map
Loading sold comps map…
Walkable amenities ~0.75 mi
Loading nearby amenities…
Taxation est. · year 1
- Rental income
- $26,877
- − Mortgage interest
- −$9,243
- − Property taxes
- −$2,475
- − Insurance
- −$825
- − Repairs & maintenance
- −$2,150
- − Management
- −$2,150
- − HOA
- −$9,288
- − Depreciation
- −$4,800
- Taxable loss
- −$4,054
- Est. tax savings @ 24.0%
- +$973
- After-tax cash flow
- $-766/yr
For passive investors: Depreciation is non-cash, so a rental often shows a tax loss while cash-flowing — sheltering income. Rental losses are passive: they offset passive income freely, and up to $25,000/yr can offset ordinary (W-2) income if you actively participate and your MAGI is under $100k (phasing out to $0 by $150k); unused losses carry forward. On sale, claimed depreciation is recaptured at up to 25%, and gains may owe capital-gains tax (a 1031 exchange can defer both). Figures are a year-1 estimate at your 24.0% rate — not tax advice; consult a CPA.
Condition & rehab AI · 12 photos
This well-maintained townhouse in Kings Point community is move-in ready with modern updates and a good condition score.
Value-add opportunities
- Both Paint exterior walls — Enhances curb appeal and value
- Both Clean gutters — Improves drainage and property value
Renovation cost estimate screening
Value-add ROI direction
- Both Paint exterior walls — Enhances curb appeal and value ↑
- Both Clean gutters — Improves drainage and property value ↑
ⓘ Cost ranges are severity-bucket heuristics (US national rule-of-thumb). Get contractor quotes + a written scope before underwriting a rehab budget.
Schools (NCES district)
- District
- Broward
- NCES district ID
- 1200180
- Math proficiency
- 42% ▼ -18.00%
- Reading proficiency
- 53% ▼ -5.00%
- Median HH income
- $52,139
- Composite
- 40.88/100
- National rank
- #3621
- State rank
- #46 of 73 in FL
Livability — Tamarac
- Score
- 76/100
- State rank
- #239
- US rank
- #3785
Category grades
Schools grade is shown separately in the Schools card above.
Census & demographics
- Census place
- Tamarac, FL
- County
- Broward County · 1,963,430 people
- City population
- 105,666
- Metro
- Miami-Fort Lauderdale-Pompano Beach, FL
- Population (ZIP)
- 51,216
- Household income
- $62,066
- Rent vs Own
- Severe rent burden
- 1394.0
Population outlook (Broward County) Hauer SSP2
- Today (2025)
- 2,207,033 people
- By 2030
- 2,360,704 · +7.0%
- By 2040
- 2,661,208 · +20.6%
- By 2050
- 2,946,698 · +33.5%
- By 2075
- 3,602,273 · +63.2%
- By 2100
- 3,970,984 · +79.9%
Race, ethnicity, and origin ACS 2023
- Neighborhood character
- Highly diverse neighborhood (Simpson 0.70)
- Race & ethnicity
- Hispanic / Latino 34% White 33% Black 27% Two or more races 20% Asian 3%
- Hispanic origin (detail)
- Mexican 2% Puerto Rican 5% Cuban 5% Dominican 3%
- Common ancestry
- Romanian 3% Hispanic 3% Scotch-Irish 2%
- Foreign-born
- 38% · Canada, Jamaica, Dominican Republic
- Languages at home
- 63% English-only · Spanish 29% French/Haitian/Cajun 4% Other Indo-European 1%
Political lean MEDSL · Broward
- 2024 margin
- D (+17.0) · D 58.0% · R 41.0%
- 2008→2024 swing
- -17.8pp toward R · 2008: 34.7pp · 2024: 17.0pp
- All cycles
- 2024: D+17.0 2020: D+29.8 2016: D+35.0 2012: D+34.9 2008: D+34.7
Not yet ingested
- Civics
- —
Market trends
- HPI YoY
- ▼ -158.63%
- Current HPI
- 362.2989
- Rent YoY
- ▼ -1.86%
- Metro
- Miami-Fort Lauderdale-Pompano Beach, FL
- State GDP YoY
- ▲ 3.28%
- F500 in state
- 36
Industry mix (Fortune 500 HQ in FL)
| Industry | F500 HQs | Revenue |
|---|---|---|
| Industrial Technology | 2 | $29B |
|
||
| Insurance | 2 | $17B |
|
||
| Retail | 1 | $60B |
|
||
| Technology Distribution | 1 | $58B |
|
||
| Homebuilding | 1 | $35B |
|
||
| Technology Manufacturing | 1 | $35B |
|
||
Price history
1 event — show timeline
- 2026-05-08 Listed $175,000 Beaches MLS
Cash-flow waterfall
monthlySold comps — $/sqft
last 12 mo · ≤1 miLoading sold comps…