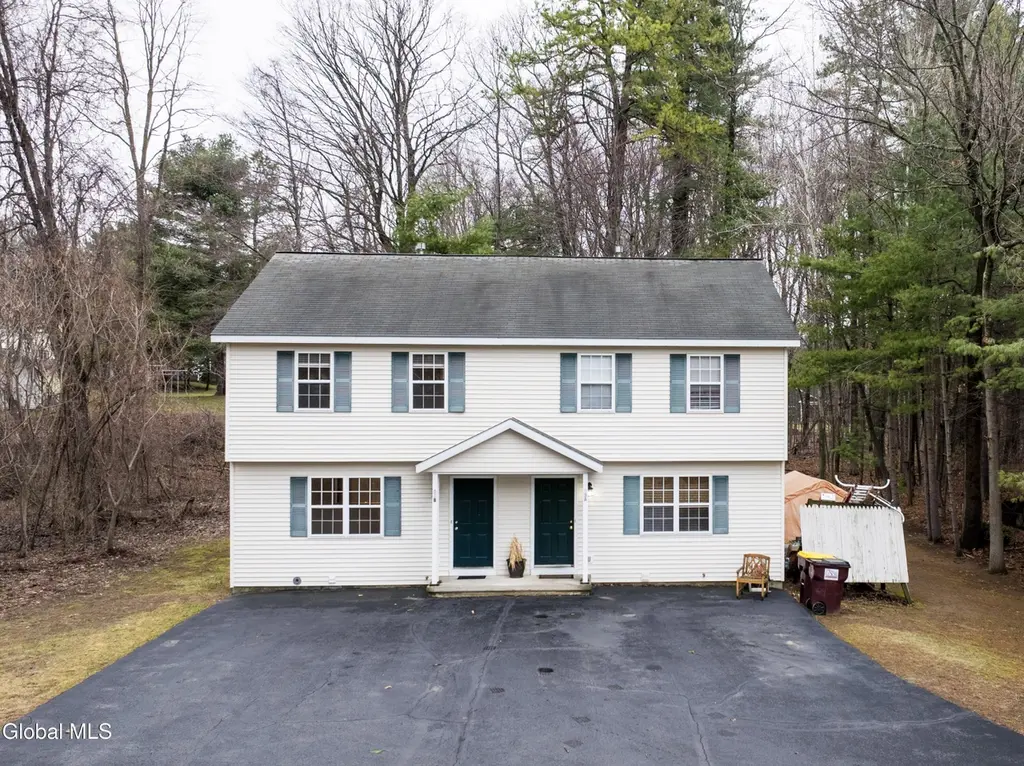
33 Cambridge Dr
Clifton Gardens, NY 12065
$469,900D-
4 bd · 3.0 ba ·
2,088 sqft ·
Built 2001
· MultiFamily
· Pending
· 6 DOM
Cashflow @ list (25.0% down · 7.5%)
Estimated rent
$3,785/mo
Mortgage (P&I)
−$2,464
Tax + insurance
−$750
HOA
−$0
Vac / Maint / Mgmt
−$795
Net cashflow
$-224/mo
Annual
$-2,685/yr
Cap rate
5.72%
Cash-on-cash
-2.04%
DSCR
0.91
1% rule
0.81%
Cash to close
$131,572
Investor read
- This is a 2 × 2.0-bed/1.5-bath units multifamily listed at $470k.
- At list price, monthly cash flow is $-224 ($-3k/yr) — negative. Per door: $-112/mo.
- To cash-flow at today's rent, offer at most $430k (8.4% below list).
- To meet the 1% rule (rent ≥ 1% of price), the offer needs to be $378k (19.5% below list).
- Only 6 days on market — expect competitive offers; lowballing is unlikely to land.
- Recommended offer: $378k (19.5% below list) — sets the bar for 1% rule.
- Local home prices are declining (-3.0%/yr); year-one equity from $3k of loan paydown is wiped out by about $14k of value loss. Plan a longer hold.
- Location reads: area grade D — affects rentability + tenant quality, not the cash-flow math above.
- Shenendehowa Central School District (suburban): math 72% / reading 73% proficiency, ranked #98 of 590 in NY (top 17%) — strong family-tenant draw, lease renewals of 3-5y typical; only 10% free/reduced lunch — higher-income household profile.
- Zoned schools: Shatekon Elementary School (math 72% / reading 70%, grade A-, #434 of 2,108 statewide, top 21%, 532 students, 29% FRL); Shenendehowa High School (math 97% / reading 82%, grade A+, #265 of 1,100 statewide, top 26%, 3,036 students, 21% FRL).
- Market conditions: Rents rising fast (+4.7%/yr); 265 active listings in the ZIP; 2 comparable units currently listed for rent nearby; high-income renter base; 1,132 units permitted in Saratoga County in 2024 (378 in 5+ unit buildings).
- Saratoga County population projected at +4% by 2050 — modest demand growth; plan on rents tracking national, not racing it.
- 2 sale attempts since 7y ago with the ask held roughly flat each time — persistent listings suggest the price (not the market) is what's stuck; bring a comps-based counter.
- Current owner paid $45k; list at $470k implies a 944% gain — meaningful room to come down on a strong offer.
- Cap rate 5.7% vs local median 3.3% in Clifton Gardens — top-decile yield for the area; either an underpriced asset or a hidden risk that comps aren't pricing in. Stress-test before assuming the spread holds.
- This rent runs 40% of the median local income ($114k/yr) — at the standard rent-burdened threshold; future hikes will face affordability resistance.
Questions for listing agent
- What do current leases actually rent for vs. the listed asking? Can we see a recent rent roll and the last 12 months of T-12 income?
- Can we see the unit-by-unit rent roll, current vacancy, and any below-market leases? What's the average tenancy length?
- What capital expenditures (roof, boiler, parking lot, exteriors) have been made in the last 5 years, and what's planned in the next 2?
- Is there a deadline driving the sale (1031 exchange, divorce, estate, relocation)? That informs how much negotiation room exists.
- The area grade is low — what's the realistic commute time and amenity access for the typical tenant pool here? Any planned neighborhood developments (good or bad) we should know about?
- What's the average days-on-market for RENTAL listings here right now (not sales)? A rising rental-DOM trend means longer vacancies and softer asking-rent achievability than the comps imply.
- What's the recent tenant-quality profile in this submarket — average credit score on applications, eviction rate, late-payment / NSF rate, and stable-employment percentage? A property-management company in the area should have these aggregated.
- How much new apartment / multifamily construction is in the pipeline within 1–3 miles? Heavy new supply (>2% of stock underway) typically softens rents 12–24 months out; light construction supports rent growth.
CashFlowRE · CFR-TDB6V137RP5FSF
· Data 3 weeks ago
cashflowre.app · 2026-05-29