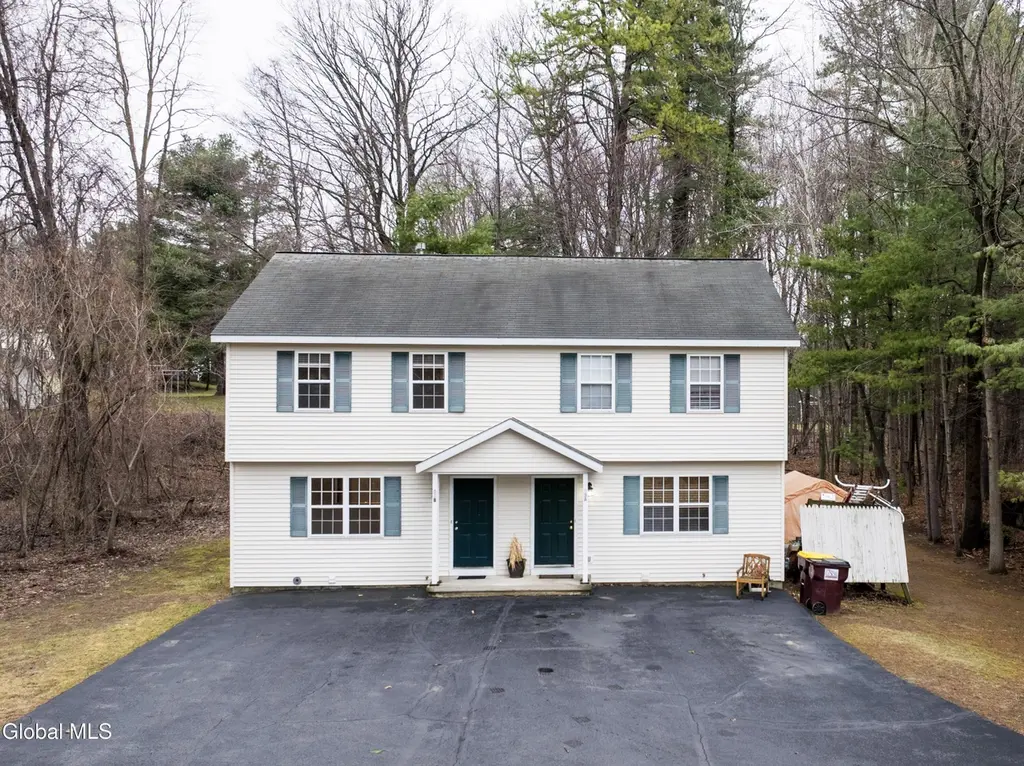
 Duplex
33 Cambridge Dr · Clifton Gardens, NY
Flood risk 1/10 · Minimal
- FEMA flood zone
- X
- Chance of flooding over 30 yrs
- 0.0%
- Est. flood insurance / yr
- $473 – $860
Fire risk 3/10 · Minor
- Est. fire insurance / yr
- $691 – $1,283
Heat risk 3/10 · Minor
- Hot days now (above 96°F)
- 7 days/yr
- Hot days in 30 yrs
- 16 days/yr
Wind risk 3/10 · Minor
- Chance of severe wind over 30 yrs
- 5.0%
Air-quality risk 1/10 · Minimal
- Unhealthy air days now
- 0 days/yr
- Unhealthy air days in 30 yrs
- 0 days/yr
Risk factors via First Street. Map © Google.
Why this score? — see what drove the D- grade
The composite is a weighted blend of 9 inputs, each scored 0–100. Each bar is that input's sub-score; the figure is the points it added to the 100-point composite (weight × sub-score).
- Cash flow +10.7/30.0
- ARV discount +7.5/15.0
- Schools +6.5/10.0
- Rent growth +3.7/5.0
- 1% rule +3.1/10.0
- DSCR +3.1/10.0
- Livability +2.5/5.0
- Condition / age +2.5/5.0
- Appreciation +0.0/10.0
$469,900
🖨 Deal sheet 📄 Offer letter ✓ Due diligence
Multi-family units
County records classify this as Multi-Family (2-4 Unit). Listing-text estimate: 2 units. confirmed
Listing remarks
Well-maintained side-by-side duplex located on a quiet dead-end Cul-De-Sac in the highly desirable Shenendehowa Central School District. Each unit offers 2 bedrooms and 1.5 baths, along with a full basement featuring washer/dryer hookups and a utility sink. Unit 2 (B) has been recently updated with all new appliances, flooring, and carpeting. Spacious layout includes two large bedrooms, one with a walk-in closet. Enjoy private back patios overlooking a peaceful wooded backyard. Property features a large shared driveway Conveniently located near major highways, shopping, restaurants, and schools. Ideal for investors or owner-occupants.
Key facts
- Wooded backyard
- Side-by-side duplex
- Full basement
Tags
Neighborhood map
What this means for you Summary
Snapshot
- This is a 2 × 2.0-bed/1.5-bath units multifamily listed at $470k.
Deal economics
- At list price, monthly cash flow is $-224 ($-3k/yr) — negative. Per door: $-112/mo.
- To cash-flow at today's rent, offer at most $430k (8.4% below list).
- To meet the 1% rule (rent ≥ 1% of price), the offer needs to be $378k (19.5% below list).
- Recommended offer: $378k (19.5% below list) — sets the bar for 1% rule.
- Cap rate 5.7% vs local median 3.3% in Clifton Gardens — top-decile yield for the area; either an underpriced asset or a hidden risk that comps aren't pricing in. Stress-test before assuming the spread holds.
Location & tenants
- Location reads: area grade D — affects rentability + tenant quality, not the cash-flow math above.
- Shenendehowa Central School District (suburban): math 72% / reading 73% proficiency, ranked #98 of 590 in NY (top 17%) — strong family-tenant draw, lease renewals of 3-5y typical; only 10% free/reduced lunch — higher-income household profile.
- Zoned schools: Shatekon Elementary School (math 72% / reading 70%, grade A-, #434 of 2,108 statewide, top 21%, 532 students, 29% FRL); Shenendehowa High School (math 97% / reading 82%, grade A+, #265 of 1,100 statewide, top 26%, 3,036 students, 21% FRL).
- Market conditions: Rents rising fast (+4.7%/yr); 265 active listings in the ZIP; 2 comparable units currently listed for rent nearby; high-income renter base; 1,132 units permitted in Saratoga County in 2024 (378 in 5+ unit buildings).
- This rent runs 40% of the median local income ($114k/yr) — at the standard rent-burdened threshold; future hikes will face affordability resistance.
Forward outlook
- Local home prices are declining (-3.0%/yr); year-one equity from $3k of loan paydown is wiped out by about $14k of value loss. Plan a longer hold.
- Saratoga County population projected at +4% by 2050 — modest demand growth; plan on rents tracking national, not racing it.
Negotiation context
- Only 6 days on market — expect competitive offers; lowballing is unlikely to land.
- 2 sale attempts since 7y ago with the ask held roughly flat each time — persistent listings suggest the price (not the market) is what's stuck; bring a comps-based counter.
- Current owner paid $45k; list at $470k implies a 944% gain — meaningful room to come down on a strong offer.
Questions for the listing agent
- What do current leases actually rent for vs. the listed asking? Can we see a recent rent roll and the last 12 months of T-12 income?
- Can we see the unit-by-unit rent roll, current vacancy, and any below-market leases? What's the average tenancy length?
- What capital expenditures (roof, boiler, parking lot, exteriors) have been made in the last 5 years, and what's planned in the next 2?
- Is there a deadline driving the sale (1031 exchange, divorce, estate, relocation)? That informs how much negotiation room exists.
- The area grade is low — what's the realistic commute time and amenity access for the typical tenant pool here? Any planned neighborhood developments (good or bad) we should know about?
- What's the average days-on-market for RENTAL listings here right now (not sales)? A rising rental-DOM trend means longer vacancies and softer asking-rent achievability than the comps imply.
- What's the recent tenant-quality profile in this submarket — average credit score on applications, eviction rate, late-payment / NSF rate, and stable-employment percentage? A property-management company in the area should have these aggregated.
- How much new apartment / multifamily construction is in the pipeline within 1–3 miles? Heavy new supply (>2% of stock underway) typically softens rents 12–24 months out; light construction supports rent growth.
Investment metrics
- 1% rule
- 0.81% ✗
- Cap rate
- 5.72%
- Cash-on-cash
- -2.04%
- DSCR
- 0.91
- GRM
- 10.3
CMA / ARV
No comps found within radius.
Projected returns pro-forma
-3.0% appreciation · 4.65% rent growth · sell at horizon
- IRR
- -17.9%
- Equity multiple
- 0.36×
- Total profit
- $-83,971
- Equity at exit
- $70,064
- IRR
- -7.2%
- Equity multiple
- 0.51×
- Total profit
- $-64,215
- Equity at exit
- $40,628
Cash invested: $131,572 (down + closing). Projections, not guarantees.
Landlord ↔ Tenant lean methodology
- Overall (STATE)
- 15 Strongly Tenant-Friendly
- State New York
- 15 Strongly Tenant-Friendly · D+10
- County
- — inherits STATE
- City
- — inherits STATE
ZIP-level market 12065
- Rents YoY
- 4.7%
- Active inventory
- 265
- Price-to-rent
- 20.7×
Monthly cashflow live
- Estimated rent
- $3,785 high interval (Pro) →
- Mortgage (P&I)
- −$2,464
- Tax from tax record
- −$554 /mo · $6,647/yr
- Insurance
- −$196
- HOA
- −$0
- Vacancy / Maint / Mgmt
- −$795
- Net cashflow
- $-224
Break-even live
2-unit breakdown (identical units grouped — click to expand)
| Units | Beds | Baths | Est. rent |
|---|---|---|---|
| 2× units | 2.0 | 1.5 | $3,784 |
| #1 | 2.0 | 1.5 | $1,892 |
| #2 | 2.0 | 1.5 | $1,892 |
| Total (2 units) | $3,785 | ||
UW: 25.0% down · 7.5% · 30yr · 1.5% tax · 5.0% vac · 8.0% maint · 8.0% mgmt
Financing live
Cash to close
- Down payment
- $117,475
- Closing costs
- $14,097
- Reserves months
- —
- Total cash needed
- —
Loan-product check · same deal, 3 products live
Conventional
25% down · 7.5% · 30yr
- Down + closing
- —
- Monthly P&I
- —
- Monthly cashflow
- —
- DSCR
- —
- Eligible?
- —
Personal DTI + credit; lowest rate.
DSCR
20% down · 8.5% · 30yr
- Down + closing
- —
- Monthly P&I
- —
- Monthly cashflow
- —
- DSCR
- —
- Eligible?
- —
No personal income docs; deal must DSCR.
Hard money
10% down · 12.0% · 12mo
- Down + closing
- —
- Monthly P&I
- —
- Monthly cashflow
- —
- DSCR
- —
- Eligible?
- —
Short-term bridge; refi at stabilization.
Rent comps 2 comps
| Address | Beds | Baths | Sqft | Rent | $/sqft | DOM | Units | Dist |
|---|---|---|---|---|---|---|---|---|
| 1 Lakeview Dr Clifton Park, NY | 1.0–3.0 | 1.0–2.0 | 1119 | $2,302 | $2.06 | 14d | 25 | 0.71mi |
| 26 Ponderosa Dr Clifton Park, NY | 3.0 | 2.5 | 1408 | $2,750 | $1.95 | 18d | 1 | 1.02mi |
Listing history 7 events
-
2026-04-06status Pending
-
2026-03-31$469,900 Active
-
2019-08-30historical
-
2019-07-30price $399,900
-
2019-07-17price $405,000
-
2019-07-17$404,000 New
-
2001-03-21soldstatus $45,000
ⓘ Source: listings_history table (triggers on properties + properties_extension) + one-shot
backfill from property_details.listing_events for pre-trigger history.
Tax reassessment forecast NY · Partial reset (capped growth)
- Current annual tax
- $6,647 · $554/mo
- Projected year-2 tax
- $7,294 · $608/mo
- Expected delta
- +$647/yr (+$54/mo · 9.7%)
ⓘ Screening estimate from a state-policy table — verify with the county assessor before closing.
Climate risk First Street
- Flood 1/10 Low FEMA zone X · 0% chance over 30 yrs
- Wildfire 3/10 Moderate
- Heat 3/10 Moderate 7 d/yr ≥96°F today · 16 d/yr by 30 yrs out
- Wind 3/10 Moderate 5% chance of damaging wind over 30 yrs
- Air quality 1/10 Low 0 unhealthy d/yr today · 0 by 30 yrs out
Nearby sold comps map
Loading sold comps map…
Walkable amenities ~0.75 mi
Loading nearby amenities…
Taxation est. · year 1
- Rental income
- $45,420
- − Mortgage interest
- −$26,322
- − Property taxes
- −$6,647
- − Insurance
- −$2,350
- − Repairs & maintenance
- −$3,634
- − Management
- −$3,634
- − Depreciation
- −$13,670
- Taxable loss
- −$10,835
- Est. tax savings @ 24.0%
- +$2,600
- After-tax cash flow
- $-85/yr
For passive investors: Depreciation is non-cash, so a rental often shows a tax loss while cash-flowing — sheltering income. Rental losses are passive: they offset passive income freely, and up to $25,000/yr can offset ordinary (W-2) income if you actively participate and your MAGI is under $100k (phasing out to $0 by $150k); unused losses carry forward. On sale, claimed depreciation is recaptured at up to 25%, and gains may owe capital-gains tax (a 1031 exchange can defer both). Figures are a year-1 estimate at your 24.0% rate — not tax advice; consult a CPA.
Schools (NCES district)
- District
- Shenendehowa Central School District
- NCES district ID
- 3626670
- Math proficiency
- 72% ▼ -6.00%
- Reading proficiency
- 73% ▲ 3.00%
- Median HH income
- $82,933
- Composite
- 64.59/100
- National rank
- #531
- State rank
- #98 of 590 in NY
Livability — Clifton Gardens
No livability data for this city. (Only ~50 U.S. cities are tracked.)
Census & demographics
- County
- Saratoga County · 166,192 people
- City population
- 44,726
- Metro
- Albany-Schenectady-Troy, NY
- Population (ZIP)
- 45,116
- Household income
- $113,873
- Rent vs Own
- Severe rent burden
- 1040.0
Population outlook (Saratoga County) Hauer SSP2
- Today (2025)
- 238,889 people
- By 2030
- 243,681 · +2.0%
- By 2040
- 249,118 · +4.3%
- By 2050
- 248,638 · +4.1%
- By 2075
- 241,675 · +1.2%
- By 2100
- 213,150 · -10.8%
Race, ethnicity, and origin ACS 2023
- Neighborhood character
- Predominantly White (81%)
- Race & ethnicity
- White 81% Asian 7% Two or more races 7% Hispanic / Latino 4% Black 2%
- Common ancestry
- Romanian 6% Lithuanian 5% Italian 2%
- Foreign-born
- 12% · Canada, China, Jamaica
- Languages at home
- 86% English-only · Other Indo-European 4% Russian/Polish/Slavic 2% Spanish 2%
Political lean MEDSL · Saratoga
- 2024 margin
- Toss-up / Even · D 50.9% · R 49.1%
- 2008→2024 swing
- -1.6pp toward R · 2008: 3.4pp · 2024: 1.8pp
- All cycles
- 2024: D+1.8 2020: D+5.4 2016: R+4.4 2012: D+2.1 2008: D+3.4
Not yet ingested
- Civics
- —
Market trends
- HPI YoY
- ▼ -201.12%
- Current HPI
- 318.0765
- Rent YoY
- ▲ 4.65%
- Metro
- Albany-Schenectady-Troy, NY
- State GDP YoY
- ▲ 2.60%
- F500 in state
- 92
Industry mix (Fortune 500 HQ in NY)
| Industry | F500 HQs | Revenue |
|---|---|---|
| Financial Services | 10 | $950B |
|
||
| Consumer Goods | 9 | $162B |
|
||
| Insurance | 4 | $225B |
|
||
| Telecommunications | 2 | $144B |
|
||
| Pharmaceuticals | 2 | $112B |
|
||
| Media / Entertainment | 2 | $69B |
|
||
Price history
+944.2% since first listed7 events — show timeline
- 2026-04-06 Pending — Global MLS
- 2026-03-31 Listed $469,900 Global MLS
- 2019-08-30 Listing Removed — Global MLS
- 2019-07-30 Price Changed $399,900 Global MLS
- 2019-07-17 Price Changed $405,000 Global MLS
- 2019-07-17 Listed $404,000 Global MLS
- 2001-03-21 Sold (Public Records) $45,000 Public Records
Property tax history
+1.6%/yrLatest (2025): $6,647 · +3.7% YoY. Source: county tax records.
Cash-flow waterfall
monthlySold comps — $/sqft
last 12 mo · ≤1 miLoading sold comps…