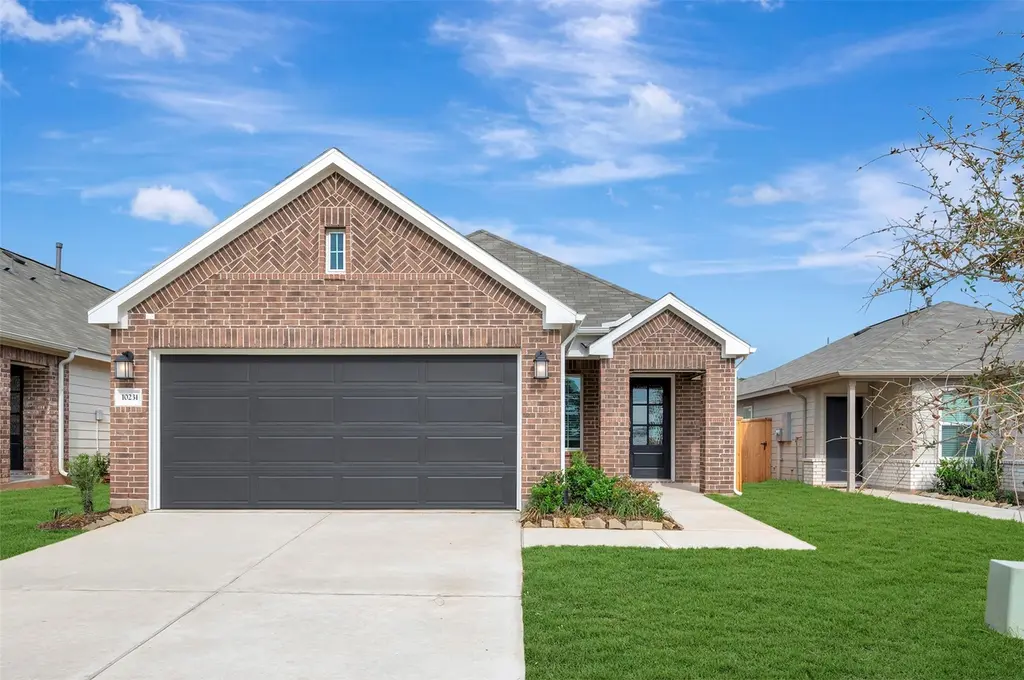
10231 Burton Path
Conroe, TX 77316
$259,990D
3 bd · 2.0 ba ·
1,491 sqft ·
Built 2025
· Land
· Pending
· 117 DOM
Cashflow @ list (25.0% down · 7.5%)
Estimated rent
$2,031/mo
Mortgage (P&I)
−$1,363
Tax + insurance
−$205
HOA
−$60
Vac / Maint / Mgmt
−$427
Net cashflow
$-24/mo
Annual
$-287/yr
Cap rate
6.18%
Cash-on-cash
-0.39%
DSCR
0.98
1% rule
0.78%
Cash to close
$72,797
Investor read
- This is a 3-bed/2.0-bath land listed at $260k.
- At list price, monthly cash flow is $-24 ($-287/yr) — negative.
- To cash-flow at today's rent, offer at most $256k (1.6% below list).
- To meet the 1% rule (rent ≥ 1% of price), the offer needs to be $203k (21.9% below list).
- It's been on market 117 days — a 9% lower offer ($237k) is reasonable based on typical stale-listing flexibility.
- Recommended offer: $203k (21.9% below list) — sets the bar for 1% rule.
- Local home prices are declining (-3.0%/yr); year-one equity from $2k of loan paydown is wiped out by about $8k of value loss. Plan a longer hold.
- Location reads 74/100 on livability (#169 in TX, #4,447 nationally) — a middle-class / working-renter tenant base. Strengths: cost of living A+, housing A+, amenities B; Watch: commute F, health & safety F.
- Montgomery ISD (rural): math 63% / reading 57% proficiency, ranked #49 of 826 in TX (top 6%) — acceptable for families but not a draw, mixed tenant base, ~2y average lease.
- Zoned schools: Lone Star El (math 57% / reading 61%, grade B-, #455 of 4,322 statewide, top 11%, 766 students, 16% FRL); Montgomery J H (math 68% / reading 54%, grade B+, #145 of 1,662 statewide, top 9%, 1,045 students, 30% FRL); Montgomery H S (math 53% / reading 62%, grade C, #327 of 1,632 statewide, top 20%, 1,556 students, 25% FRL) — zoned schools at 24% FRL track the district average.
- Market conditions: Rents flat; 2300 active listings in the ZIP; high-income renter base; 13,259 units permitted in Montgomery County in 2024 (1,402 in 5+ unit buildings).
- Montgomery County population projected at +65% by 2050 — long-run rental-demand tailwind backs the buy-and-hold thesis.
- 2 sale attempts with the ask held roughly flat each time — persistent listings suggest the price (not the market) is what's stuck; bring a comps-based counter.
- Cap rate 6.2% vs local median 3.1% in Conroe — top-decile yield for the area; either an underpriced asset or a hidden risk that comps aren't pricing in. Stress-test before assuming the spread holds.
Questions for listing agent
- What do current leases actually rent for vs. the listed asking? Can we see a recent rent roll and the last 12 months of T-12 income?
- It's been on market 117 days. Have you received any prior offers? Is the seller open to a 22% concession, seller financing, or rate buy-down credit?
- What does the HOA fee cover, when was the last increase, and are there any pending special assessments or reserve-fund shortfalls?
- Why hasn't it sold? Are there any deal-killer items the seller is aware of (foundation, flood, title, zoning, code violations)?
- Is there a deadline driving the sale (1031 exchange, divorce, estate, relocation)? That informs how much negotiation room exists.
- Schools are D-rated, which usually means shorter tenancies and higher turnover. Who's the typical renter profile here, and what's been the actual vacancy rate?
- The area grade is low — what's the realistic commute time and amenity access for the typical tenant pool here? Any planned neighborhood developments (good or bad) we should know about?
- What's the average days-on-market for RENTAL listings here right now (not sales)? A rising rental-DOM trend means longer vacancies and softer asking-rent achievability than the comps imply.
CashFlowRE · CFR-TEW5Z6FPRW6RAK
· Data 1 week ago
cashflowre.app · 2026-05-29