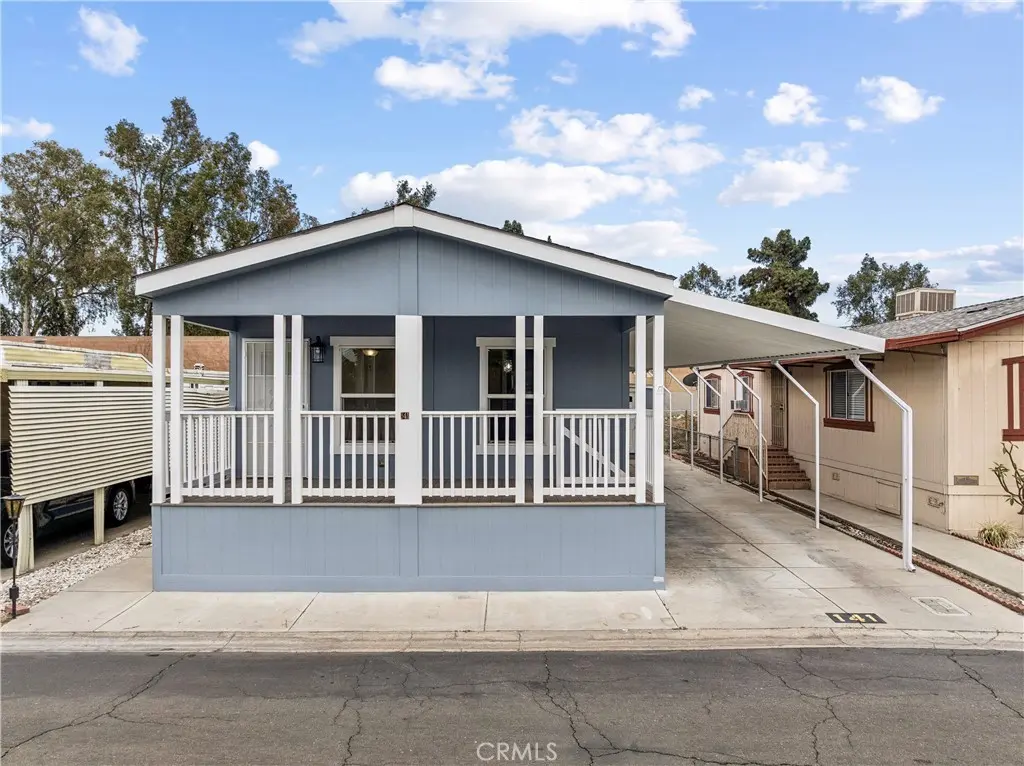
10550 Dunlap Xing #141
West Whittier-Los Nietos, CA 90606
$255,000B-
2 bd · 2.0 ba ·
1,160 sqft ·
Built 2015
· Manufactured
· Active
· 24 DOM
Cashflow @ list (25.0% down · 7.5%)
Estimated rent
$2,765/mo
Mortgage (P&I)
−$1,337
Tax + insurance
−$225
HOA
−$0
Vac / Maint / Mgmt
−$581
Net cashflow
$622/mo
Annual
$7,460/yr
Cap rate
9.22%
Cash-on-cash
10.45%
DSCR
1.46
1% rule
1.08%
Cash to close
$71,400
Investor read
- This is a 2-bed/2.0-bath manufactured listed at $255k. Condition is rated good.
- At list price, monthly cash flow is $622 ($7k/yr) — positive.
- The deal already cash-flows at list — no discount required.
- Meets the 1% rule at list price ($3k rent vs $255k).
- It's been on market 24 days — a 2% lower offer ($251k) is reasonable based on typical stale-listing flexibility.
- Recommended offer: $251k (1.5% below list) — sets the bar for market timing.
- Local home prices are declining (-3.0%/yr); year-one equity from $2k of loan paydown is wiped out by about $8k of value loss. Plan a longer hold.
- Location reads: area grade B — affects rentability + tenant quality, not the cash-flow math above.
- Whittier Union High (suburban): math 42% / reading 65% proficiency, ranked #111 of 517 in CA (top 22%) — acceptable for families but not a draw, mixed tenant base, ~2y average lease.
- Zoned schools: Daniel Phelan Elementary (534 students, 50% FRL); Katherine Edwards Middle (916 students, 73% FRL); Santa Fe High (math 44% / reading 66%, grade C, #249 of 1,170 statewide, top 22%, 1,935 students, 79% FRL) — zoned schools average 67% FRL vs 26% district-wide (42 pts higher); higher-poverty schools than district average — tighter screening recommended.
- Market conditions: 34 active listings in the ZIP; 16 comparable units currently listed for rent nearby; rentals leasing fast (median 13d on market — plan ~1-2 weeks tenant-placement turnaround); solid renter incomes; 19,697 units permitted in Los Angeles County in 2024 (9,426 in 5+ unit buildings).
- Los Angeles County population projected at +9% by 2050 — modest demand growth; plan on rents tracking national, not racing it.
- Climate carrying-cost: moderate flood risk; extreme-heat days projected 6→17/yr by 2055 (HVAC capex compounding) — expect insurance premiums to compound above CPI over the hold.
- Cap rate 9.2% vs local median 2.8% in West Whittier-Los Nietos — top-decile yield for the area; either an underpriced asset or a hidden risk that comps aren't pricing in. Stress-test before assuming the spread holds.
- This rent runs 33% of the median local income ($100k/yr) — at the standard rent-burdened threshold; future hikes will face affordability resistance.
Questions for listing agent
- Is there a deadline driving the sale (1031 exchange, divorce, estate, relocation)? That informs how much negotiation room exists.
- What's the average days-on-market for RENTAL listings here right now (not sales)? A rising rental-DOM trend means longer vacancies and softer asking-rent achievability than the comps imply.
- What's the recent tenant-quality profile in this submarket — average credit score on applications, eviction rate, late-payment / NSF rate, and stable-employment percentage? A property-management company in the area should have these aggregated.
- How much new for-sale + rental construction is in the pipeline within 1–3 miles? Heavy new supply typically softens prices + rents 12–24 months out; constrained supply supports both.
CashFlowRE · CFR-TGACH5699TBFYE
· Data 19 h ago
cashflowre.app · 2026-05-29