10550 Dunlap Xing #141 · West Whittier-Los Nietos, CA
Flood risk 5/10 · Moderate
- FEMA flood zone
- X
- Chance of flooding over 30 yrs
- 0.24%
- Est. flood insurance / yr
- $507 – $1,088
Fire risk 1/10 · Minimal
- Est. fire insurance / yr
- $659 – $1,223
Heat risk 6/10 · Moderate
- Hot days now (above 95°F)
- 6 days/yr
- Hot days in 30 yrs
- 17 days/yr
Wind risk 1/10 · Minimal
- Chance of severe wind over 30 yrs
- —
Air-quality risk 6/10 · Moderate
- Unhealthy air days now
- 9 days/yr
- Unhealthy air days in 30 yrs
- 10 days/yr
Risk factors via First Street. Map © Google.
Why this score? — see what drove the B- grade
The composite is a weighted blend of 9 inputs, each scored 0–100. Each bar is that input's sub-score; the figure is the points it added to the 100-point composite (weight × sub-score).
- Cash flow +25.8/30.0
- ARV discount +11.3/15.0
- DSCR +8.6/10.0
- 1% rule +5.8/10.0
- Schools +4.7/10.0
- Condition / age +4.0/5.0
- Rent growth +2.5/5.0
- Livability +2.5/5.0
- Appreciation +0.0/10.0
$255,000
🖨 Deal sheet (PDF) 📄 Offer letter ✓ Due diligence
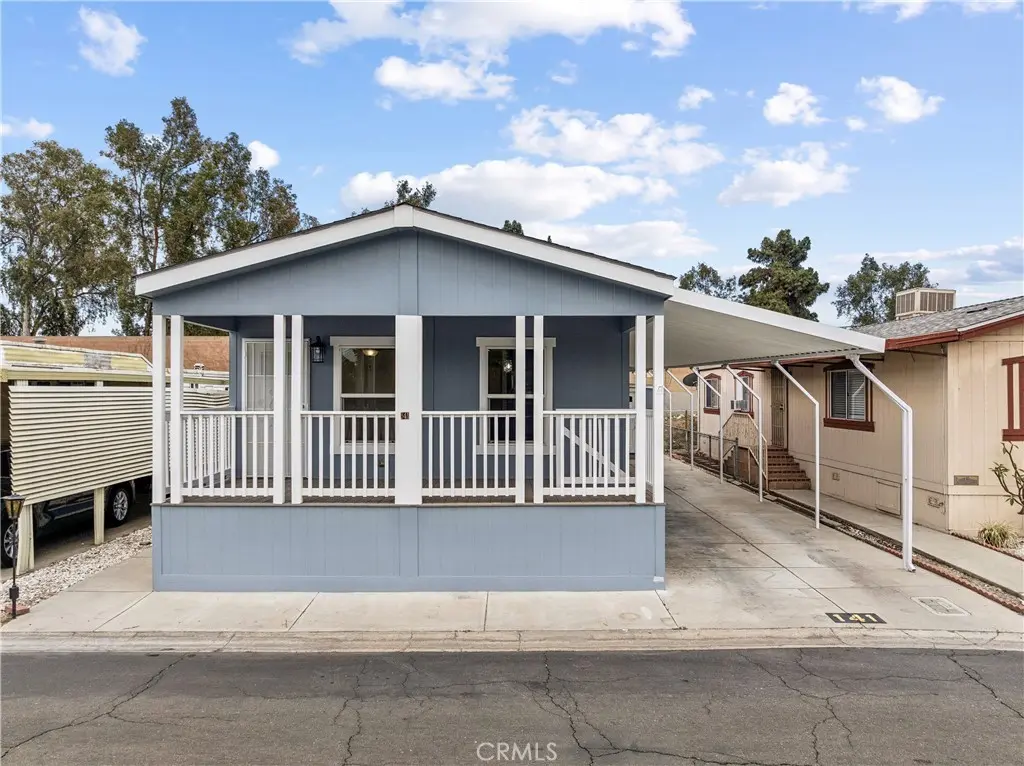
Listing remarks
Wow, what a property!!! Welcome to Whittier Mobile Country Club, a wonderful 55+ Senior Community with fantastic amenities and even better homes. This 2-bedroom, 2-bathroom mobile home is truly exceptional, offering plenty of space, wonderful upgrades, low maintenance, and a location as private as you can get within the community. The mobile home is situated at the cul-de-sac of the community, where you’ll find very few cars or people crossing the street most of the time. The property features a lovely, newly painted front porch, perfect for enjoying the sunrise each morning with a cup of coffee. The home has been completely renovated, with new paint inside and out, fresh flooring, ne
Key facts
- Cul-de-sac location
- Serviced ac system
- Completely renovated
Tags
Property features AI
Finance
- Other: Manager approval required; Pets allowed
- Financial info: Land lease amount applies
- HOA & community: Whittier Mobile Home Country Club park; Association amenities include sauna, golf, pool, spa; Senior community; Community features include golf course; Land lease applies
Exterior
- Parking: 2 garage spaces; 2 carport spaces; Guest parking (total 4 parking spaces)
- Utilities: Standard electric service; Natural gas connected; Public/District water; Public sewer
- Home design: Single-story (1 total story); Mobile home remains on site; Faces west
- Construction: Shingle roof; Pillar/post/pier foundation; Mobile home approximately 21 ft wide by 60 ft long; Year built reported by seller
- Exterior features: Front porch; Community pool; Wood skirting; 1 shed; Has patio
Interior
- Kitchen: Microwave; Refrigerator; Gas range; Dishwasher
- Flooring: Vinyl flooring
- Bathrooms: 2 upgraded full bathrooms with bathtub
- Heating & cooling: Central heating (furnace); Central cooling
- Interior features: Front entry; Community spa; Double-pane windows
- Laundry & utility: Inside laundry; Has laundry
Neighborhood map
What this means for you Summary
Snapshot
- This is a 2-bed/2.0-bath manufactured listed at $255k. Condition is rated good.
Deal economics
- At list price, monthly cash flow is $622 ($7k/yr) — positive.
- The deal already cash-flows at list — no discount required.
- Meets the 1% rule at list price ($3k rent vs $255k).
- Recommended offer: $251k (1.5% below list) — sets the bar for market timing.
- Cap rate 9.2% vs local median 2.8% in West Whittier-Los Nietos — top-decile yield for the area; either an underpriced asset or a hidden risk that comps aren't pricing in. Stress-test before assuming the spread holds.
Location & tenants
- Location reads: area grade B — affects rentability + tenant quality, not the cash-flow math above.
- Whittier Union High (suburban): math 42% / reading 65% proficiency, ranked #111 of 517 in CA (top 22%) — acceptable for families but not a draw, mixed tenant base, ~2y average lease.
- Zoned schools: Daniel Phelan Elementary (534 students, 50% FRL); Katherine Edwards Middle (916 students, 73% FRL); Santa Fe High (math 44% / reading 66%, grade C, #249 of 1,170 statewide, top 22%, 1,935 students, 79% FRL) — zoned schools average 67% FRL vs 26% district-wide (42 pts higher); higher-poverty schools than district average — tighter screening recommended.
- Market conditions: 34 active listings in the ZIP; 16 comparable units currently listed for rent nearby; rentals leasing fast (median 13d on market — plan ~1-2 weeks tenant-placement turnaround); solid renter incomes; 19,697 units permitted in Los Angeles County in 2024 (9,426 in 5+ unit buildings).
- This rent runs 33% of the median local income ($100k/yr) — at the standard rent-burdened threshold; future hikes will face affordability resistance.
Forward outlook
- Local home prices are declining (-3.0%/yr); year-one equity from $2k of loan paydown is wiped out by about $8k of value loss. Plan a longer hold.
- Los Angeles County population projected at +9% by 2050 — modest demand growth; plan on rents tracking national, not racing it.
Negotiation context
- It's been on market 24 days — a 2% lower offer ($251k) is reasonable based on typical stale-listing flexibility.
Risks & watch-outs
- Climate carrying-cost: moderate flood risk; extreme-heat days projected 6→17/yr by 2055 (HVAC capex compounding) — expect insurance premiums to compound above CPI over the hold.
Questions for the listing agent
- Is there a deadline driving the sale (1031 exchange, divorce, estate, relocation)? That informs how much negotiation room exists.
- What's the average days-on-market for RENTAL listings here right now (not sales)? A rising rental-DOM trend means longer vacancies and softer asking-rent achievability than the comps imply.
- What's the recent tenant-quality profile in this submarket — average credit score on applications, eviction rate, late-payment / NSF rate, and stable-employment percentage? A property-management company in the area should have these aggregated.
- How much new for-sale + rental construction is in the pipeline within 1–3 miles? Heavy new supply typically softens prices + rents 12–24 months out; constrained supply supports both.
Investment metrics
- 1% rule
- 1.08% ✓
- Cap rate
- 9.22%
- Cash-on-cash
- 10.45%
- DSCR
- 1.46
- GRM
- 7.7
CMA / ARV
- ARV (on-the-fly)
- $278,400
- Comps found
- 4
Show comp detail 4 sales within ~0.75 mi
| Address | Dist | Beds/Ba | Sqft | Sold | Price | $/sf | Match |
|---|---|---|---|---|---|---|---|
| 10550 Dunlap Crossing Rd #74 | 0.02mi | 2/2.0 | 1,200 (+3%) | 0mo | $175,000 | $146 | 93 |
| 10550 Dunlap Crossing Rd #171 | 0.03mi | 2/2.0 | 1,200 (+3%) | 11mo | $255,000 | $213 | 84 |
| 10550 Dunlap Crossing Rd #100 | 0.00mi | 3/2.0 (+1) | 1,120 (-3%) | 13mo | $269,000 | $240 | 79 |
| 10550 Dunlap Crossing Rd #55 | 0.01mi | 2/2.0 | 1,040 (-10%) | 6mo | $259,000 | $249 | 77 |
Match score weights: distance 35% · size 25% · config 20% · recency 20%. Top-matched comps best support the ARV.
Projected returns pro-forma
-3.0% appreciation · 3.0% rent growth · sell at horizon
- IRR
- -0.7%
- Equity multiple
- 0.97×
- Total profit
- $-1,805
- Equity at exit
- $38,021
- IRR
- 9.0%
- Equity multiple
- 1.69×
- Total profit
- $49,086
- Equity at exit
- $22,048
Cash invested: $71,400 (down + closing). Projections, not guarantees.
Landlord ↔ Tenant lean methodology
- Overall (STATE)
- 18 Strongly Tenant-Friendly
- State California
- 18 Strongly Tenant-Friendly · D+13
- County
- — inherits STATE
- City
- — inherits STATE
ZIP-level market 90606
- Active inventory
- 34
- Price-to-rent
- 7.7×
Monthly cashflow live
- Estimated rent
- $2,765 high interval (Pro) →
- Mortgage (P&I)
- −$1,337
- Tax from tax record
- −$119 /mo · $1,427/yr
- Insurance
- −$106
- HOA
- −$0
- Vacancy / Maint / Mgmt
- −$581
- Net cashflow
- $622
Break-even live
Sensitivity live
| Price | -10% $766 | -5% $694 | +0% $622 | +5% $550 | +10% $477 |
|---|---|---|---|---|---|
| Rent | -10% $403 | -5% $512 | +0% $622 | +5% $731 | +10% $840 |
| Rate | -1.0pp $750 | -0.5pp $687 | base $622 | +0.5pp $556 | +1.0pp $488 |
UW: 25.0% down · 7.5% · 30yr · 1.5% tax · 5.0% vac · 8.0% maint · 8.0% mgmt
Financing live
Cash to close
- Down payment
- $63,750
- Closing costs
- $7,650
- Reserves months
- —
- Total cash needed
- —
Loan-product check · same deal, 3 products live
Conventional
25% down · 7.5% · 30yr
- Down + closing
- —
- Monthly P&I
- —
- Monthly cashflow
- —
- DSCR
- —
- Eligible?
- —
Personal DTI + credit; lowest rate.
DSCR
20% down · 8.5% · 30yr
- Down + closing
- —
- Monthly P&I
- —
- Monthly cashflow
- —
- DSCR
- —
- Eligible?
- —
No personal income docs; deal must DSCR.
Hard money
10% down · 12.0% · 12mo
- Down + closing
- —
- Monthly P&I
- —
- Monthly cashflow
- —
- DSCR
- —
- Eligible?
- —
Short-term bridge; refi at stabilization.
Rent comps 16 comps
| Address | Beds | Baths | Sqft | Rent | $/sqft | DOM | Units | Dist |
|---|---|---|---|---|---|---|---|---|
| 7411 Norwalk Blvd Whittier, CA | 2.0 | 2.0 | 995 | $2,500 | $2.51 | 26d | 1 | 0.24mi |
| 11443 Dicky St Whittier, CA | 3.0 | 2.0 | 1235 | $3,800 | $3.08 | 0d | 1 | 0.74mi |
| 8028 Boer Ave Unit 03 Whittier, CA | 1.0 | 1.0 | 725 | $1,850 | $2.55 | 0d | 1 | 0.78mi |
| 8121 Broadway Ave Whittier, CA | 1.0–3.0 | 1.0–2.0 | 779 | $2,504 | $3.21 | 0d | 9 | 0.85mi |
| 9050 Carron Dr Pico Rivera, CA | 1.0 | 1.0 | 623 | $2,439 | $3.91 | 6d | 7 | 1.14mi |
| 10509 El Rancho Dr Whittier, CA | 3.0 | 1.0 | 960 | $900 | $0.94 | 26d | 1 | 1.21mi |
| 7806 Wellsford Ave Whittier, CA | 2.0 | 1.0 | 912 | $3,299 | $3.62 | 12d | 1 | 1.25mi |
| 4928 Durfee Ave Pico Rivera, CA | 2.0 | 2.0 | 1000 | $2,695 | $2.69 | 0d | 2 | 1.30mi |
| 11918 Greyford St Unit 4 Whittier, CA | 2.0 | 1.0 | 800 | $2,050 | $2.56 | 22d | 1 | 1.32mi |
| 10726 Orange Grv Unit 21 Whittier, CA | 2.0 | 1.0 | 1000 | $2,100 | $2.10 | 23d | 1 | 1.33mi |
| 10733 Orange Grv Unit 33-03 Whittier, CA | 3.0 | 1.5 | 1100 | $2,795 | $2.54 | 22d | 1 | 1.36mi |
| 5593 Pioneer Blvd #18 Whittier, CA | 2.0 | 1.5 | 880 | $2,650 | $3.01 | 8d | 1 | 1.38mi |
| 7820 Farmland Ave Pico Rivera, CA | 3.0 | 1.0 | 800 | $3,295 | $4.12 | 6d | 1 | 1.44mi |
| 10717 Shire Pl Apt 6 Whittier, CA | 2.0 | 2.0 | 980 | $2,750 | $2.81 | 26d | 1 | 1.46mi |
| 7320 Rosemead Blvd Pico Rivera, CA | 2.0 | 2.0 | 883 | $2,650 | $3.00 | 21d | 3 | 1.47mi |
| 10820 Hunter Ave Whittier, CA | 3.0 | 1.0 | 1316 | $4,200 | $3.19 | 0d | 1 | 1.50mi |
Listing history 17 events
-
2026-06-21days on market $255,000 Active 24 DOM
-
2026-06-18days on market $255,000 Active 21 DOM
-
2026-06-17days on market $255,000 Active 20 DOM
-
2026-06-16days on market $255,000 Active 19 DOM
-
2026-06-15price $255,000 Active 18 DOM
-
2026-06-15days on market $265,000 Active 18 DOM
-
2026-06-13days on market $265,000 Active 16 DOM
-
2026-06-13days on market $265,000 Active 15 DOM
-
2026-06-09days on market $265,000 Active 12 DOM
-
2026-06-08days on market $265,000 Active 11 DOM
-
2026-06-07days on market $265,000 Active 10 DOM
-
2026-06-04days on market $265,000 Active 7 DOM
-
2026-06-03days on market $265,000 Active 6 DOM
-
2026-06-02days on market $265,000 Active 5 DOM
-
2026-06-01days on market $265,000 Active 4 DOM
-
2026-05-31days on market $265,000 Active 3 DOM
-
2026-05-28$265,000 Active
ⓘ Source: listings_history table (triggers on properties + properties_extension) + one-shot
backfill from property_details.listing_events for pre-trigger history.
Tax reassessment forecast CA · Resets to sale price
- Current annual tax
- $1,427 · $119/mo
- Projected year-2 tax
- $1,938 · $162/mo
- Expected delta
- +$511/yr (+$43/mo · 35.8%)
ⓘ Screening estimate from a state-policy table — verify with the county assessor before closing.
Climate risk First Street
- Flood 5/10 Major FEMA zone X · 24% chance over 30 yrs
- Wildfire 1/10 Low
- Heat 6/10 Major 6 d/yr ≥95°F today · 17 d/yr by 30 yrs out
- Wind 1/10 Low
- Air quality 6/10 Major 9 unhealthy d/yr today · 10 by 30 yrs out
Nearby sold comps map
Loading sold comps map…
Walkable amenities ~0.75 mi
Loading nearby amenities…
Taxation est. · year 1
- Rental income
- $33,177
- − Mortgage interest
- −$14,284
- − Property taxes
- −$1,427
- − Insurance
- −$1,275
- − Repairs & maintenance
- −$2,654
- − Management
- −$2,654
- − Depreciation
- −$7,418
- Taxable income
- $3,464
- Est. tax owed @ 24.0%
- −$831
- After-tax cash flow
- $6,629/yr
For passive investors: Depreciation is non-cash, so a rental often shows a tax loss while cash-flowing — sheltering income. Rental losses are passive: they offset passive income freely, and up to $25,000/yr can offset ordinary (W-2) income if you actively participate and your MAGI is under $100k (phasing out to $0 by $150k); unused losses carry forward. On sale, claimed depreciation is recaptured at up to 25%, and gains may owe capital-gains tax (a 1031 exchange can defer both). Figures are a year-1 estimate at your 24.0% rate — not tax advice; consult a CPA.
Condition & rehab AI · 12 photos
This 2-bedroom, 2-bathroom mobile home is in excellent condition with recent renovations, making it move-in ready and ideal for both resale and rental.
Value-add opportunities
- Both Painting the exterior — Enhances curb appeal and value
- Both Landscaping improvements — Enhances curb appeal and value
- Both New flooring in bathrooms — Improves aesthetics and functionality
Renovation cost estimate screening
Value-add ROI direction
- Both Painting the exterior — Enhances curb appeal and value ↑
- Both Landscaping improvements — Enhances curb appeal and value ↑
- Both New flooring in bathrooms — Improves aesthetics and functionality ↑
ⓘ Cost ranges are severity-bucket heuristics (US national rule-of-thumb). Get contractor quotes + a written scope before underwriting a rehab budget.
Schools (NCES district)
- District
- Whittier Union High
- NCES district ID
- 0642480
- Math proficiency
- 42% ▲ 9.00%
- Reading proficiency
- 65% ▲ 7.00%
- Median HH income
- $66,675
- Composite
- 47.19/100
- National rank
- #2321
- State rank
- #111 of 517 in CA
Livability — West Whittier-Los Nietos
No livability data for this city. (Only ~50 U.S. cities are tracked.)
Census & demographics
- Census place
- West Whittier-Los Nietos, CA
- County
- Los Angeles County · 9,444,647 people
- City population
- 31,881
- Metro
- Los Angeles-Long Beach-Anaheim, CA
- Population (ZIP)
- 32,057
- Household income
- $100,428
- Rent vs Own
- Severe rent burden
- 556.0
Population outlook (Los Angeles County) Hauer SSP2
- Today (2025)
- 10,940,515 people
- By 2030
- 11,256,481 · +2.9%
- By 2040
- 11,729,929 · +7.2%
- By 2050
- 11,948,407 · +9.2%
- By 2075
- 11,818,114 · +8.0%
- By 2100
- 10,842,928 · -0.9%
Race, ethnicity, and origin ACS 2023
- Neighborhood character
- Predominantly Hispanic (85%)
- Race & ethnicity
- Hispanic / Latino 85% Two or more races 17% White 8% Asian 5% Native American 2% Black 1%
- Hispanic origin (detail)
- Mexican 76%
- Foreign-born
- 24% · Canada, South Korea, Vietnam
- Languages at home
- 41% English-only · Spanish 55% Tagalog/Filipino 2% Korean 1%
Political lean MEDSL · Los Angeles
- 2024 margin
- Solid D (+32.9) · D 64.8% · R 31.9% · Other 3.3%
- 2008→2024 swing
- -7.4pp toward R · 2008: 40.4pp · 2024: 32.9pp
- All cycles
- 2024: D+32.9 2020: D+44.2 2016: D+48.0 2012: D+40.0 2008: D+40.4
Not yet ingested
- Civics
- —
Market trends
- HPI YoY
- ▼ -973.24%
- Current HPI
- 428.5874
- Rent YoY
- —
- Metro
- Los Angeles-Long Beach-Anaheim, CA
- State GDP YoY
- ▲ 3.21%
- F500 in state
- 116
Industry mix (Fortune 500 HQ in CA)
| Industry | F500 HQs | Revenue |
|---|---|---|
| Technology | 27 | $1,492B |
|
||
| Financial Services | 3 | $174B |
|
||
| Retail | 3 | $44B |
|
||
| Insurance | 3 | $26B |
|
||
| Media / Entertainment | 2 | $115B |
|
||
| Pharmaceuticals / Biotech | 2 | $62B |
|
||
Price history
1 event — show timeline
- 2026-05-28 Listed $265,000 CRMLS
Property tax history
+7.4%/yrLatest (2025): $1,427 · +7.4% YoY. Source: county tax records.
Cash-flow waterfall
monthlySold comps — $/sqft
last 12 mo · ≤1 miLoading sold comps…