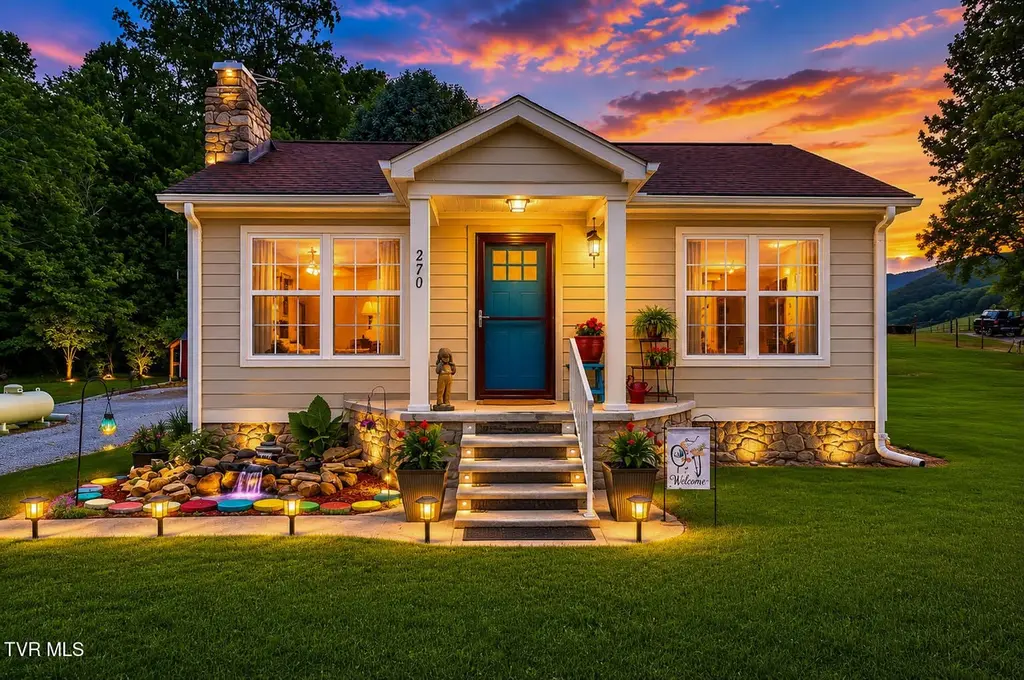
270 Bowers Ln
Hunter, TN 37643
$10,000F
3 bd · 2.0 ba ·
1,518 sqft ·
Built 1936
· SingleFamily
· Active
· 8 DOM
Cashflow @ list (25.0% down · 7.5%)
Estimated rent
$1,432/mo
Mortgage (P&I)
−$1,138
Tax + insurance
−$187
HOA
−$0
Vac / Maint / Mgmt
−$301
Net cashflow
$-194/mo
Annual
$-2,327/yr
Cap rate
5.53%
Cash-on-cash
-2.73%
DSCR
0.88
1% rule
0.66%
Cash to close
$60,781
Investor read
- This is a 3-bed/2.0-bath single-family listed at $10k.
- At list price, monthly cash flow is $-194 ($-2k/yr) — negative.
- The deal already cash-flows at list — no discount required.
- Meets the 1% rule at list price ($1k rent vs $10k).
- Only 8 days on market — expect competitive offers; lowballing is unlikely to land.
- Local home prices are declining (-3.0%/yr); year-one equity from $2k of loan paydown is wiped out by about $7k of value loss. Plan a longer hold.
- Location reads 61/100 on livability (#258 in TN) — a middle-class / working-renter tenant base. Strengths: cost of living A+, housing A-, crime B+; Watch: amenities F, commute F, employment D-.
- Carter County (suburban): math 16% / reading 23% proficiency, ranked #119 of 139 in TN (top 86%) — low school quality limits family demand, transient renter base, plan for 1-2y turnover.
- Zoned schools: Hunter Elementary (math 15% / reading 21%, grade F, #697 of 952 statewide, top 74%, 433 students, 0% FRL); Unaka High School (math 12% / reading 32%, grade F, #163 of 332 statewide, top 51%, 315 students, 0% FRL) — zoned schools average 0% FRL vs 60% district-wide (60 pts lower); this property's tenant base skews higher-income than the district average.
- Watch-outs: property tax is 4.9% of price; flood insurance adds $56/mo; built in 1936 — expect roof / HVAC / electrical / plumbing capex.
- Market conditions: 173 active listings in the ZIP; 184 units permitted in Carter County in 2024 (0 in 5+ unit buildings).
- Carter County population projected at -21% by 2050 — secular population decline; favor cash flow + early exit over multi-decade hold.
- Climate carrying-cost: severe flood risk; major wildfire risk — expect insurance premiums to compound above CPI over the hold.
- Cap rate 5.5% vs local median 3.1% in Hunter — top-decile yield for the area; either an underpriced asset or a hidden risk that comps aren't pricing in. Stress-test before assuming the spread holds.
Questions for listing agent
- What do current leases actually rent for vs. the listed asking? Can we see a recent rent roll and the last 12 months of T-12 income?
- Built in 1936 — when were the roof, HVAC, electrical panel, plumbing, and water heater last replaced?
- Property tax is high relative to price — has the assessment been appealed recently, and will the sale trigger a re-assessment?
- What's the actual annual flood-insurance premium (NFIP or private), and is the property in a SFHA with mandatory coverage?
- Is there a deadline driving the sale (1031 exchange, divorce, estate, relocation)? That informs how much negotiation room exists.
- Schools are F-rated, which usually means shorter tenancies and higher turnover. Who's the typical renter profile here, and what's been the actual vacancy rate?
- The area grade is low — what's the realistic commute time and amenity access for the typical tenant pool here? Any planned neighborhood developments (good or bad) we should know about?
- What's the average days-on-market for RENTAL listings here right now (not sales)? A rising rental-DOM trend means longer vacancies and softer asking-rent achievability than the comps imply.
CashFlowRE · CFR-TGG3YBCEV0T4SP
· Data 1 day ago
cashflowre.app · 2026-05-29