 🔨 Auction
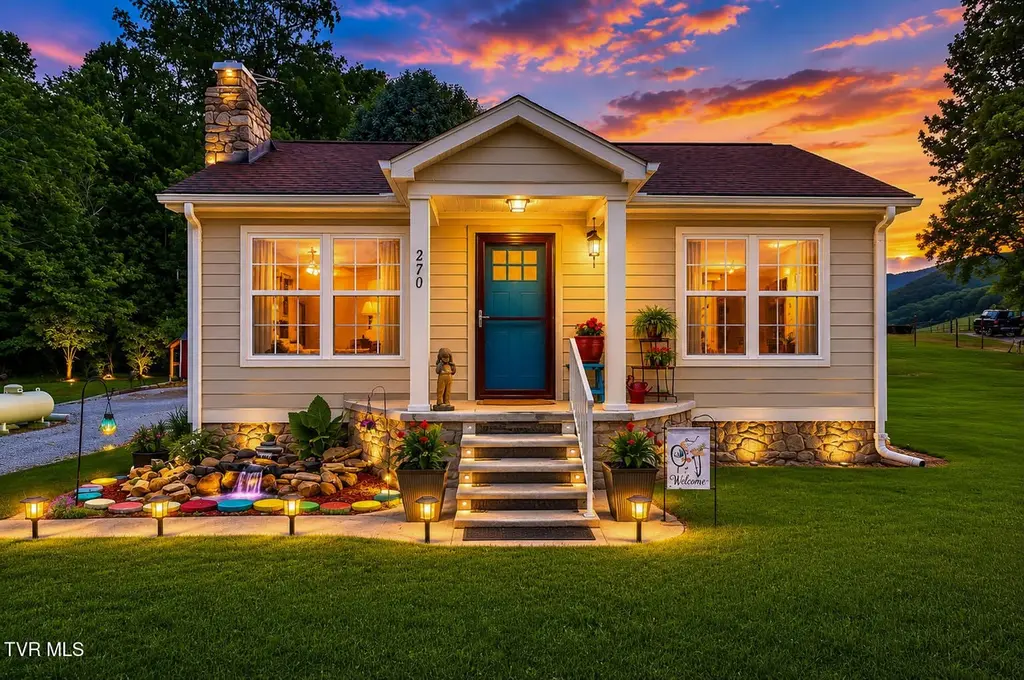
270 Bowers Ln · Hunter, TN
Flood risk 8/10 · Major
- FEMA flood zone
- X (unshaded)
- Chance of flooding over 30 yrs
- 0.99%
- Est. flood insurance / yr
- $473 – $860
Fire risk 6/10 · Moderate
- Est. fire insurance / yr
- $949 – $1,763
Heat risk 4/10 · Minor
- Hot days now (above 94°F)
- 7 days/yr
- Hot days in 30 yrs
- 20 days/yr
Wind risk 2/10 · Minimal
- Chance of severe wind over 30 yrs
- —
Air-quality risk 2/10 · Minimal
- Unhealthy air days now
- 1 days/yr
- Unhealthy air days in 30 yrs
- 1 days/yr
Risk factors via First Street. Map © Google.
Why this score? — see what drove the F grade
The composite is a weighted blend of 9 inputs, each scored 0–100. Each bar is that input's sub-score; the figure is the points it added to the 100-point composite (weight × sub-score).
- Cash flow +9.8/30.0
- ARV discount +7.5/15.0
- Livability +3.1/5.0
- DSCR +2.8/10.0
- Rent growth +2.5/5.0
- Condition / age +2.5/5.0
- 1% rule +1.6/10.0
- Schools +1.6/10.0
- Appreciation +0.0/10.0
$10,000
🖨 Deal sheet 📄 Offer letter ✓ Due diligence
Listing remarks
THE LISTING PRICE BY NO MEANS SHOULD BE CONSIDERED THE STARTING BID NOR THE FINAL CONTRACT PRICE. PRICE GIVEN TO BE ABLE TO POPULATE TO THIRD PARTY WEBSITE PROVIDERS. PUBLIC LIVE REAL ESTATE AUCTION. Live Auction on Saturday, July 11th, 2026 @ 10:00AM. Discover your private East Tennessee sanctuary at 270 Bowers Lane. Nestled in the heart of Siam Community, this charming 3-bedroom, 2-bathroom residence offers a warm, features over 1700 finished sqft. of inviting atmosphere that perfectly complements the scenic beauty of the surrounding mountains. Situated on a generous 0.78-acre lot, this property provides the perfect blend of space, privacy, and outdoor living. The interior of the home is
Key facts
- Space for an rv
- 0.78 acre lot
- Built 1936
Tags
Property features AI
Finance
- Other: Not in a subdivision
- HOA & community: Landscaping (association amenity); Senior community
Exterior
- Parking: Unpaved parking; RV access/parking; Driveway; Gravel parking; Parking pad
- Security: Smoke detector(s)
- Utilities: Public water; Septic tank
- Home design: Single-family house; Two levels
- Construction: Vinyl siding; Asphalt shingle roof; Has basement
- Exterior features: Deck; Front porch; RV/boat storage; Shed(s); Rolling slope lot; Irregular lot shape; Zoned residential
Interior
- Kitchen: Convection oven; Gas range; Refrigerator
- Bedrooms: See room details for bedroom layout
- Flooring: Ceramic tile; Vinyl; See remarks
- Bathrooms: 2 full bathrooms
- Heating & cooling: Heat pump; Central heating; Propane heating; Has cooling
- Interior features: Eat-in kitchen; Laminate counters; Pantry; Double pane windows; Smoke detectors
- Laundry & utility: Washer hookup; Electric dryer hookup; Basement with dirt floor
Neighborhood map
What this means for you Summary
Snapshot
- This is a 3-bed/2.0-bath single-family listed at $10k.
Deal economics
- At list price, monthly cash flow is $-194 ($-2k/yr) — negative.
- The deal already cash-flows at list — no discount required.
- Meets the 1% rule at list price ($1k rent vs $10k).
- Cap rate 5.5% vs local median 3.1% in Hunter — top-decile yield for the area; either an underpriced asset or a hidden risk that comps aren't pricing in. Stress-test before assuming the spread holds.
Location & tenants
- Location reads 61/100 on livability (#258 in TN) — a middle-class / working-renter tenant base. Strengths: cost of living A+, housing A-, crime B+; Watch: amenities F, commute F, employment D-.
- Carter County (suburban): math 16% / reading 23% proficiency, ranked #119 of 139 in TN (top 86%) — low school quality limits family demand, transient renter base, plan for 1-2y turnover.
- Zoned schools: Hunter Elementary (math 15% / reading 21%, grade F, #697 of 952 statewide, top 74%, 433 students, 0% FRL); Unaka High School (math 12% / reading 32%, grade F, #163 of 332 statewide, top 51%, 315 students, 0% FRL) — zoned schools average 0% FRL vs 60% district-wide (60 pts lower); this property's tenant base skews higher-income than the district average.
- Market conditions: 173 active listings in the ZIP; 184 units permitted in Carter County in 2024 (0 in 5+ unit buildings).
Forward outlook
- Local home prices are declining (-3.0%/yr); year-one equity from $2k of loan paydown is wiped out by about $7k of value loss. Plan a longer hold.
- Carter County population projected at -21% by 2050 — secular population decline; favor cash flow + early exit over multi-decade hold.
Negotiation context
- Only 8 days on market — expect competitive offers; lowballing is unlikely to land.
Risks & watch-outs
- Watch-outs: property tax is 4.9% of price; flood insurance adds $56/mo; built in 1936 — expect roof / HVAC / electrical / plumbing capex.
- Climate carrying-cost: severe flood risk; major wildfire risk — expect insurance premiums to compound above CPI over the hold.
Questions for the listing agent
- What do current leases actually rent for vs. the listed asking? Can we see a recent rent roll and the last 12 months of T-12 income?
- Built in 1936 — when were the roof, HVAC, electrical panel, plumbing, and water heater last replaced?
- Property tax is high relative to price — has the assessment been appealed recently, and will the sale trigger a re-assessment?
- What's the actual annual flood-insurance premium (NFIP or private), and is the property in a SFHA with mandatory coverage?
- Is there a deadline driving the sale (1031 exchange, divorce, estate, relocation)? That informs how much negotiation room exists.
- Schools are F-rated, which usually means shorter tenancies and higher turnover. Who's the typical renter profile here, and what's been the actual vacancy rate?
- The area grade is low — what's the realistic commute time and amenity access for the typical tenant pool here? Any planned neighborhood developments (good or bad) we should know about?
- What's the average days-on-market for RENTAL listings here right now (not sales)? A rising rental-DOM trend means longer vacancies and softer asking-rent achievability than the comps imply.
- What's the recent tenant-quality profile in this submarket — average credit score on applications, eviction rate, late-payment / NSF rate, and stable-employment percentage? A property-management company in the area should have these aggregated.
- How much new for-sale + rental construction is in the pipeline within 1–3 miles? Heavy new supply typically softens prices + rents 12–24 months out; constrained supply supports both.
Investment metrics
- 1% rule
- 0.66% ✗
- Cap rate
- 5.53%
- Cash-on-cash
- -2.73%
- DSCR
- 0.88
- GRM
- 12.6
CMA / ARV
- ARV (on-the-fly)
- $217,074
- Comps found
- 3
Show comp detail 3 sales within ~0.75 mi
| Address | Dist | Beds/Ba | Sqft | Sold | Price | $/sf | Match |
|---|---|---|---|---|---|---|---|
| 2364 Siam Road Rd | 0.42mi | 3/1.0 | 1,540 (+1%) | 24mo | $219,500 | $143 | 54 |
| 372 Wilbur Dam Rd | 0.72mi | 4/2.0 (+1) | 1,440 (-5%) | 6mo | $197,000 | $137 | 48 |
| 238 Wilbur Dam Rd | 0.67mi | 4/4.0 (+1) | 1,458 (-4%) | 17mo | $445,000 | $305 | 35 |
Match score weights: distance 35% · size 25% · config 20% · recency 20%. Top-matched comps best support the ARV.
Projected returns pro-forma
-3.0% appreciation · 3.0% rent growth · sell at horizon
- IRR
- -22.8%
- Equity multiple
- 0.22×
- Total profit
- $-47,612
- Equity at exit
- $32,366
- IRR
- -17.3%
- Equity multiple
- 0.05×
- Total profit
- $-57,713
- Equity at exit
- $18,769
Cash invested: $60,781 (down + closing). Projections, not guarantees.
Landlord ↔ Tenant lean methodology
- Overall (STATE)
- 87 Strongly Landlord-Friendly
- State Tennessee
- 87 Strongly Landlord-Friendly · R+13
- County
- — inherits STATE
- City
- — inherits STATE
ZIP-level market 37643
- Home prices YoY
- -19.3%
- Active inventory
- 173
- Price-to-rent
- 0.6×
Monthly cashflow live
- Estimated rent
- $1,432 medium interval (Pro) →
- Mortgage (P&I)
- −$1,138
- Tax from tax record
- −$41 /mo · $491/yr
- Insurance
- −$90
- Flood insurance flood zone
- −$56 /mo · $666/yr
- HOA
- −$0
- Vacancy / Maint / Mgmt
- −$301
- Net cashflow
- $-194
Break-even live
UW: 25.0% down · 7.5% · 30yr · 1.5% tax · 5.0% vac · 8.0% maint · 8.0% mgmt
Financing live
Cash to close
- Down payment
- $54,268
- Closing costs
- $6,512
- Reserves months
- —
- Total cash needed
- —
Loan-product check · same deal, 3 products live
Conventional
25% down · 7.5% · 30yr
- Down + closing
- —
- Monthly P&I
- —
- Monthly cashflow
- —
- DSCR
- —
- Eligible?
- —
Personal DTI + credit; lowest rate.
DSCR
20% down · 8.5% · 30yr
- Down + closing
- —
- Monthly P&I
- —
- Monthly cashflow
- —
- DSCR
- —
- Eligible?
- —
No personal income docs; deal must DSCR.
Hard money
10% down · 12.0% · 12mo
- Down + closing
- —
- Monthly P&I
- —
- Monthly cashflow
- —
- DSCR
- —
- Eligible?
- —
Short-term bridge; refi at stabilization.
Listing history 8 events
-
2026-06-19days on market $10,000 Active 8 DOM
-
2026-06-18days on market $10,000 Active 7 DOM
-
2026-06-17days on market $10,000 Active 6 DOM
-
2026-06-16days on market $10,000 Active 5 DOM
-
2026-06-15days on market $10,000 Active 4 DOM
-
2026-06-14days on market $10,000 Active 2 DOM
-
2026-06-13remarks 699-char remark
-
2026-06-13$10,000 Active 1 DOM
ⓘ Source: listings_history table (triggers on properties + properties_extension) + one-shot
backfill from property_details.listing_events for pre-trigger history.
Tax reassessment forecast TN · Resets to sale price
- Current annual tax
- $491 · $41/mo
- Projected year-2 tax
- $491 · $41/mo
- Expected delta
- $0/yr ($0/mo · 0.0%)
ⓘ Screening estimate from a state-policy table — verify with the county assessor before closing.
Climate risk First Street
- Flood 8/10 Severe FEMA zone X (unshaded) · 99% chance over 30 yrs
- Wildfire 6/10 Major
- Heat 4/10 Moderate 7 d/yr ≥94°F today · 20 d/yr by 30 yrs out
- Wind 2/10 Low
- Air quality 2/10 Low 1 unhealthy d/yr today · 1 by 30 yrs out
Nearby sold comps map
Loading sold comps map…
Walkable amenities ~0.75 mi
Loading nearby amenities…
Taxation est. · year 1
- Rental income
- $17,185
- − Mortgage interest
- −$12,160
- − Property taxes
- −$491
- − Insurance
- −$1,752
- − Repairs & maintenance
- −$1,375
- − Management
- −$1,375
- − Depreciation
- −$6,315
- Taxable loss
- −$6,282
- Est. tax savings @ 24.0%
- +$1,508
- After-tax cash flow
- $-819/yr
For passive investors: Depreciation is non-cash, so a rental often shows a tax loss while cash-flowing — sheltering income. Rental losses are passive: they offset passive income freely, and up to $25,000/yr can offset ordinary (W-2) income if you actively participate and your MAGI is under $100k (phasing out to $0 by $150k); unused losses carry forward. On sale, claimed depreciation is recaptured at up to 25%, and gains may owe capital-gains tax (a 1031 exchange can defer both). Figures are a year-1 estimate at your 24.0% rate — not tax advice; consult a CPA.
Schools (NCES district)
- District
- Carter County
- NCES district ID
- 4700510
- Math proficiency
- 16% ▼ -19.00%
- Reading proficiency
- 23% ▼ -8.00%
- Median HH income
- $33,744
- Composite
- 15.92/100
- National rank
- #9253
- State rank
- #119 of 139 in TN
Livability — Hunter
- Score
- 61/100
- State rank
- #258
- US rank
- #18321
Category grades
Schools grade is shown separately in the Schools card above.
Census & demographics
- Population (ZIP)
- 33,690
Population outlook (Carter County) Hauer SSP2
- Today (2025)
- 54,493 people
- By 2030
- 52,639 · -3.4%
- By 2040
- 47,929 · -12.0%
- By 2050
- 42,877 · -21.3%
- By 2075
- 31,487 · -42.2%
- By 2100
- 21,979 · -59.7%
Race, ethnicity, and origin ACS 2023
- Neighborhood character
- Predominantly White (93%)
- Race & ethnicity
- White 93% Two or more races 3% Hispanic / Latino 3% Black 2%
- Common ancestry
- Serbian 3% Slovak 2% Italian 2%
- Foreign-born
- 2% · Canada
- Languages at home
- 98% English-only · Spanish 2%
Political lean MEDSL · Carter
- 2024 margin
- Solid R (+63.2) · D 17.9% · R 81.2%
- 2008→2024 swing
- -16.1pp toward R · 2008: -47.2pp · 2024: -63.2pp
- All cycles
- 2024: R+63.2 2020: R+61.5 2016: R+64.0 2012: R+52.0 2008: R+47.2
Not yet ingested
- Civics
- —
Market trends
- HPI YoY
- ▼ -77.08%
- Current HPI
- 321.4024
- Rent YoY
- —
- Metro
- —
- State GDP YoY
- ▲ 2.78%
- F500 in state
- 22
Industry mix (Fortune 500 HQ in TN)
| Industry | F500 HQs | Revenue |
|---|---|---|
| Healthcare | 3 | $91B |
|
||
| Retail | 3 | $72B |
|
||
| Transportation / Logistics | 1 | $88B |
|
||
| Paper / Packaging | 1 | $19B |
|
||
| Insurance | 1 | $13B |
|
||
| Energy | 1 | $12B |
|
||
Price history
-81.8% since first listed3 events — show timeline
- 2026-06-11 Listed $10,000 TVRMLS
- 2018-08-15 Sold (Public Records) $62,500 Public Records
- 2016-04-29 Sold (Public Records) $55,000 Public Records
Property tax history
+0.4%/yrLatest (2025): $491 · -15.8% YoY. Source: county tax records.
Cash-flow waterfall
monthlySold comps — $/sqft
last 12 mo · ≤1 miLoading sold comps…