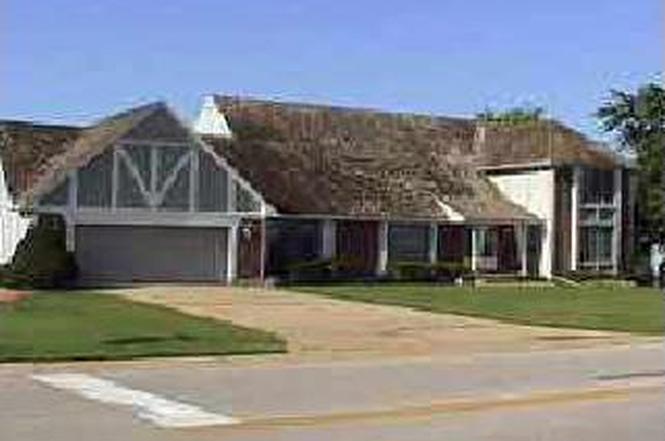
15111 E 44th St
Independence, MO 64055
$199,500D+
5 bd · 3.5 ba ·
2,805 sqft ·
Built 1975
· SingleFamily
· Coming Soon
· 5 DOM
Cashflow @ list (25.0% down · 7.5%)
Estimated rent
$1,907/mo
Mortgage (P&I)
−$1,046
Tax + insurance
−$461
HOA
−$0
Vac / Maint / Mgmt
−$400
Net cashflow
$-0/mo
Annual
$-3/yr
Cap rate
6.29%
Cash-on-cash
-0.01%
DSCR
1.00
1% rule
0.96%
Cash to close
$55,860
Investor read
- This is a 5-bed/3.5-bath single-family listed at $200k.
- At list price, monthly cash flow is $0 ($-3/yr) — negative.
- To cash-flow at today's rent, offer at most $199k (0.0% below list).
- To meet the 1% rule (rent ≥ 1% of price), the offer needs to be $191k (4.4% below list).
- Only 5 days on market — expect competitive offers; lowballing is unlikely to land.
- Recommended offer: $191k (4.4% below list) — sets the bar for 1% rule.
- Local home prices are declining (-3.0%/yr); year-one equity from $1k of loan paydown is wiped out by about $6k of value loss. Plan a longer hold.
- Location reads 82/100 on livability (#10 in MO, #1,296 nationally) — a professional / high-income tenant draw. Strengths: amenities A+, commute A+, cost of living A+; Watch: employment D+, crime F.
- Independence 30 (suburban): math 26% / reading 38% proficiency, ranked #252 of 324 in MO (top 78%) — families likely to look elsewhere, expect single-tenant / working-renter base with shorter leases.
- Zoned schools: William Southern Elem. (math 27% / reading 37%, grade F, #761 of 1,115 statewide, top 72%, 430 students, 73% FRL); Bridger Middle (math 32% / reading 38%, grade F, #240 of 391 statewide, top 62%, 770 students, 65% FRL); Truman High (math 18% / reading 34%, grade F, #430 of 521 statewide, top 83%, 1,662 students, 52% FRL) — zoned schools at 63% FRL track the district average.
- Market conditions: Rents rising fast (+5.1%/yr); 205 active listings in the ZIP; 4,002 units permitted in Jackson County in 2024 (2,271 in 5+ unit buildings).
- Jackson County population projected at +4% by 2050 — modest demand growth; plan on rents tracking national, not racing it.
- Cap rate 6.3% vs local median 5.0% in Independence — meaningfully above typical; check what's discounted (condition, days-on-market, listing class) to confirm the premium yield is real.
- This rent runs 37% of the median local income ($62k/yr) — at the standard rent-burdened threshold; future hikes will face affordability resistance.
Questions for listing agent
- What do current leases actually rent for vs. the listed asking? Can we see a recent rent roll and the last 12 months of T-12 income?
- Built in 1975 — when were the roof, HVAC, electrical panel, plumbing, and water heater last replaced?
- Is there a deadline driving the sale (1031 exchange, divorce, estate, relocation)? That informs how much negotiation room exists.
- Crime grade is F in this area — have there been break-ins, vandalism, or insurance claims at this property in the last 3 years? What carrier currently insures it and at what premium?
- The area grade is low — what's the realistic commute time and amenity access for the typical tenant pool here? Any planned neighborhood developments (good or bad) we should know about?
- What's the average days-on-market for RENTAL listings here right now (not sales)? A rising rental-DOM trend means longer vacancies and softer asking-rent achievability than the comps imply.
- What's the recent tenant-quality profile in this submarket — average credit score on applications, eviction rate, late-payment / NSF rate, and stable-employment percentage? A property-management company in the area should have these aggregated.
- How much new for-sale + rental construction is in the pipeline within 1–3 miles? Heavy new supply typically softens prices + rents 12–24 months out; constrained supply supports both.
CashFlowRE · CFR-TGVNJ8FXA38QX5
· Data 1 h ago
cashflowre.app · 2026-05-29