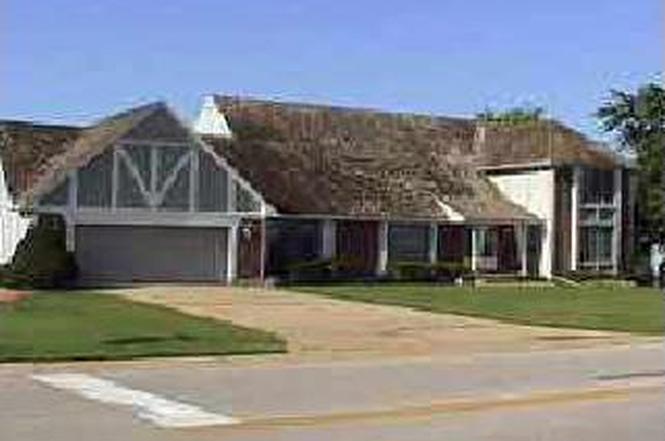
15111 E 44th St · Independence, MO
Flood risk 1/10 · Minimal
- FEMA flood zone
- X (unshaded)
- Chance of flooding over 30 yrs
- 0.0%
- Est. flood insurance / yr
- $473 – $860
Fire risk 1/10 · Minimal
- Est. fire insurance / yr
- $1,054 – $1,958
Heat risk 4/10 · Minor
- Hot days now (above 107°F)
- 7 days/yr
- Hot days in 30 yrs
- 17 days/yr
Wind risk 2/10 · Minimal
- Chance of severe wind over 30 yrs
- —
Air-quality risk 3/10 · Minor
- Unhealthy air days now
- 3 days/yr
- Unhealthy air days in 30 yrs
- 3 days/yr
Risk factors via First Street. Map © Google.
Why this score? — see what drove the D+ grade
The composite is a weighted blend of 9 inputs, each scored 0–100. Each bar is that input's sub-score; the figure is the points it added to the 100-point composite (weight × sub-score).
- ARV discount +15.0/15.0
- Cash flow +13.3/30.0
- 1% rule +4.6/10.0
- Livability +4.1/5.0
- DSCR +4.0/10.0
- Rent growth +3.8/5.0
- Schools +2.7/10.0
- Condition / age +2.5/5.0
- Appreciation +0.0/10.0
$199,500
🖨 Deal sheet (PDF) 📄 Offer letter ✓ Due diligence
Listing remarks MLS
Marble Entry, Bookcases On Each Side Of Fireplace, 2 Tier Deck, Wet Bar, Tongue & Groove Walls In Fam Rm, Ceramic Kitchen & Brkfst Rm Floor, Sunken Tub, E-Z 2nd Living Area In Finishd Bsmt, 2 Ovens, Pantry, New Roof, New Garage Door.
Key facts
- 0.39 acre lot
- 2 garage spots
- Built 1975
Property features AI
Finance
- Other: Corner lot dimensions approximately 110 x 140 feet
- HOA & community: Homeowners association present
Exterior
- Parking: Attached garage facing front; 2-car garage
- Utilities: Public water; Public sewer
- Home design: Single family residence; Residential property; 1.5-story floor plan
- Construction: Brick trim exterior; Composition roof
- Exterior features: Deck; Corner lot; Property not in a flood plain
Interior
- Kitchen: Electric range; Dishwasher; Garbage disposal; Eat-in kitchen with breakfast area and formal dining area
- Bedrooms: 4 bedrooms (beds located on first and second levels)
- Flooring: Finished basement flooring
- Bathrooms: 3 full bathrooms; 2 half bathrooms
- Heating & cooling: Forced air heating (natural gas); Electric cooling
- Interior features: Vaulted ceilings; Wet bar; Window coverings; Finished walk-out basement; Concrete full basement
- Laundry & utility: Laundry located in the kitchen
Neighborhood map
What this means for you Summary
Snapshot
- This is a 5-bed/3.5-bath single-family listed at $200k.
Deal economics
- At list price, monthly cash flow is $0 ($-3/yr) — negative.
- To cash-flow at today's rent, offer at most $199k (0.0% below list).
- To meet the 1% rule (rent ≥ 1% of price), the offer needs to be $191k (4.4% below list).
- Recommended offer: $191k (4.4% below list) — sets the bar for 1% rule.
- Cap rate 6.3% vs local median 5.0% in Independence — meaningfully above typical; check what's discounted (condition, days-on-market, listing class) to confirm the premium yield is real.
Location & tenants
- Location reads 82/100 on livability (#10 in MO, #1,296 nationally) — a professional / high-income tenant draw. Strengths: amenities A+, commute A+, cost of living A+; Watch: employment D+, crime F.
- Independence 30 (suburban): math 26% / reading 38% proficiency, ranked #252 of 324 in MO (top 78%) — families likely to look elsewhere, expect single-tenant / working-renter base with shorter leases.
- Zoned schools: William Southern Elem. (math 27% / reading 37%, grade F, #761 of 1,115 statewide, top 72%, 430 students, 73% FRL); Bridger Middle (math 32% / reading 38%, grade F, #240 of 391 statewide, top 62%, 770 students, 65% FRL); Truman High (math 18% / reading 34%, grade F, #430 of 521 statewide, top 83%, 1,662 students, 52% FRL) — zoned schools at 63% FRL track the district average.
- Market conditions: Rents rising fast (+5.1%/yr); 203 active listings in the ZIP; 4,002 units permitted in Jackson County in 2024 (2,271 in 5+ unit buildings).
- This rent runs 37% of the median local income ($62k/yr) — at the standard rent-burdened threshold; future hikes will face affordability resistance.
Forward outlook
- Local home prices are declining (-3.0%/yr); year-one equity from $1k of loan paydown is wiped out by about $6k of value loss. Plan a longer hold.
- Jackson County population projected at +4% by 2050 — modest demand growth; plan on rents tracking national, not racing it.
Negotiation context
- Only 4 days on market — expect competitive offers; lowballing is unlikely to land.
Questions for the listing agent
- What do current leases actually rent for vs. the listed asking? Can we see a recent rent roll and the last 12 months of T-12 income?
- Built in 1975 — when were the roof, HVAC, electrical panel, plumbing, and water heater last replaced?
- Is there a deadline driving the sale (1031 exchange, divorce, estate, relocation)? That informs how much negotiation room exists.
- Crime grade is F in this area — have there been break-ins, vandalism, or insurance claims at this property in the last 3 years? What carrier currently insures it and at what premium?
- The area grade is low — what's the realistic commute time and amenity access for the typical tenant pool here? Any planned neighborhood developments (good or bad) we should know about?
- What's the average days-on-market for RENTAL listings here right now (not sales)? A rising rental-DOM trend means longer vacancies and softer asking-rent achievability than the comps imply.
- What's the recent tenant-quality profile in this submarket — average credit score on applications, eviction rate, late-payment / NSF rate, and stable-employment percentage? A property-management company in the area should have these aggregated.
- How much new for-sale + rental construction is in the pipeline within 1–3 miles? Heavy new supply typically softens prices + rents 12–24 months out; constrained supply supports both.
Investment metrics
- 1% rule
- 0.96% ✗
- Cap rate
- 6.29%
- Cash-on-cash
- -0.01%
- DSCR
- 1.00
- GRM
- 8.7
CMA / ARV
- ARV (on-the-fly)
- $330,990
- Comps found
- 12
Show comp detail 12 sales within ~0.75 mi
| Address | Dist | Beds/Ba | Sqft | Sold | Price | $/sf | Match |
|---|---|---|---|---|---|---|---|
| 4336 S Dover Ave | 0.18mi | 5/2.5 | 2,889 (+3%) | 11mo | $275,000 | $95 | 74 |
| 14613 E 44th St S | 0.28mi | 4/2.5 (-1) | 2,898 (+3%) | 8mo | $275,000 | $95 | 66 |
| 14930 Tomasha Dr | 0.13mi | 4/3.0 (-1) | 2,416 (-14%) | 2mo | $325,000 | $135 | 62 |
| 15501 E 43rd Ter S | 0.29mi | 4/4.0 (-1) | 2,556 (-9%) | 3mo | $310,000 | $121 | 62 |
| 14600 E 43rd St S | 0.42mi | 4/3.5 (-1) | 2,581 (-8%) | 4mo | $275,000 | $107 | 58 |
| 4822 Logan Ave | 0.54mi | 4/3.5 (-1) | 2,910 (+4%) | 8mo | $420,000 | $144 | 57 |
| 4309 S Huntington Way | 0.44mi | 4/3.5 (-1) | 2,612 (-7%) | 11mo | $340,000 | $130 | 54 |
| 4309 S Cromwell Dr | 0.32mi | 5/3.0 | 2,410 (-14%) | 11mo | $349,900 | $145 | 50 |
| 14501 Tomasha Dr | 0.41mi | 4/2.5 (-1) | 2,563 (-9%) | 15mo | $289,000 | $113 | 45 |
| 3912 S Christopher Cir | 0.68mi | 4/3.0 (-1) | 3,168 (+13%) | 0mo | $325,000 | $103 | 39 |
| 14617 E 41st St S | 0.59mi | 4/2.5 (-1) | 2,516 (-10%) | 10mo | $250,000 | $99 | 37 |
| 14403 E 49th Ter | 0.72mi | 4/2.0 (-1) | 2,432 (-13%) | 14mo | $287,000 | $118 | 22 |
Match score weights: distance 35% · size 25% · config 20% · recency 20%. Top-matched comps best support the ARV.
Projected returns pro-forma
-3.0% appreciation · 5.09% rent growth · sell at horizon
- IRR
- -13.7%
- Equity multiple
- 0.50×
- Total profit
- $-28,144
- Equity at exit
- $29,746
- IRR
- -1.6%
- Equity multiple
- 0.88×
- Total profit
- $-6,562
- Equity at exit
- $17,249
Cash invested: $55,860 (down + closing). Projections, not guarantees.
Landlord ↔ Tenant lean methodology
- Overall (STATE)
- 81 Strongly Landlord-Friendly
- State Missouri
- 81 Strongly Landlord-Friendly · R+10
- County
- — inherits STATE
- City
- — inherits STATE
ZIP-level market 64055
- Rents YoY
- 5.1%
- Active inventory
- 203
- Price-to-rent
- 8.7×
Monthly cashflow live
- Estimated rent
- $1,907 medium interval (Pro) →
- Mortgage (P&I)
- −$1,046
- Tax from tax record
- −$377 /mo · $4,529/yr
- Insurance
- −$83
- HOA
- −$0
- Vacancy / Maint / Mgmt
- −$400
- Net cashflow
- $-0
Break-even live
Sensitivity live
| Price | -10% $113 | -5% $56 | +0% $0 | +5% $-57 | +10% $-113 |
|---|---|---|---|---|---|
| Rent | -10% $-151 | -5% $-76 | +0% $0 | +5% $75 | +10% $150 |
| Rate | -1.0pp $100 | -0.5pp $50 | base $0 | +0.5pp $-52 | +1.0pp $-105 |
UW: 25.0% down · 7.5% · 30yr · 1.5% tax · 5.0% vac · 8.0% maint · 8.0% mgmt
Financing live
Cash to close
- Down payment
- $49,875
- Closing costs
- $5,985
- Reserves months
- —
- Total cash needed
- —
Loan-product check · same deal, 3 products live
Conventional
25% down · 7.5% · 30yr
- Down + closing
- —
- Monthly P&I
- —
- Monthly cashflow
- —
- DSCR
- —
- Eligible?
- —
Personal DTI + credit; lowest rate.
DSCR
20% down · 8.5% · 30yr
- Down + closing
- —
- Monthly P&I
- —
- Monthly cashflow
- —
- DSCR
- —
- Eligible?
- —
No personal income docs; deal must DSCR.
Hard money
10% down · 12.0% · 12mo
- Down + closing
- —
- Monthly P&I
- —
- Monthly cashflow
- —
- DSCR
- —
- Eligible?
- —
Short-term bridge; refi at stabilization.
Listing history 2 events
-
2026-06-21days on market $199,500 Coming Soon 4 DOM
-
2026-06-18$199,500 Coming Soon 1 DOM
ⓘ Source: listings_history table (triggers on properties + properties_extension) + one-shot
backfill from property_details.listing_events for pre-trigger history.
Tax reassessment forecast MO · Resets to sale price
- Current annual tax
- $4,529 · $377/mo
- Projected year-2 tax
- $4,529 · $377/mo
- Expected delta
- $0/yr ($0/mo · 0.0%)
ⓘ Screening estimate from a state-policy table — verify with the county assessor before closing.
Climate risk First Street
- Flood 1/10 Low FEMA zone X (unshaded) · 0% chance over 30 yrs
- Wildfire 1/10 Low
- Heat 4/10 Moderate 7 d/yr ≥107°F today · 17 d/yr by 30 yrs out
- Wind 2/10 Low
- Air quality 3/10 Moderate 3 unhealthy d/yr today · 3 by 30 yrs out
Nearby sold comps map
Loading sold comps map…
Walkable amenities ~0.75 mi
Loading nearby amenities…
Taxation est. · year 1
- Rental income
- $22,882
- − Mortgage interest
- −$11,175
- − Property taxes
- −$4,529
- − Insurance
- −$998
- − Repairs & maintenance
- −$1,831
- − Management
- −$1,831
- − Depreciation
- −$5,804
- Taxable loss
- −$3,284
- Est. tax savings @ 24.0%
- +$788
- After-tax cash flow
- $785/yr
For passive investors: Depreciation is non-cash, so a rental often shows a tax loss while cash-flowing — sheltering income. Rental losses are passive: they offset passive income freely, and up to $25,000/yr can offset ordinary (W-2) income if you actively participate and your MAGI is under $100k (phasing out to $0 by $150k); unused losses carry forward. On sale, claimed depreciation is recaptured at up to 25%, and gains may owe capital-gains tax (a 1031 exchange can defer both). Figures are a year-1 estimate at your 24.0% rate — not tax advice; consult a CPA.
Schools (NCES district)
- District
- Independence 30
- NCES district ID
- 2915480
- Math proficiency
- 26% ▼ -8.00%
- Reading proficiency
- 38% ▼ -5.00%
- Median HH income
- $41,843
- Composite
- 27.04/100
- National rank
- #7054
- State rank
- #252 of 324 in MO
Livability — Independence
- Score
- 82/100
- State rank
- #10
- US rank
- #1296
Category grades
Schools grade is shown separately in the Schools card above.
Census & demographics
- Census place
- Independence, MO
- County
- Jackson County · 687,798 people
- City population
- 117,675
- Metro
- Kansas City, MO-KS
- Population (ZIP)
- 35,960
- Household income
- $62,439
- Rent vs Own
- Severe rent burden
- 1404.0
Population outlook (Jackson County) Hauer SSP2
- Today (2025)
- 719,589 people
- By 2030
- 731,456 · +1.6%
- By 2040
- 746,689 · +3.8%
- By 2050
- 749,289 · +4.1%
- By 2075
- 736,227 · +2.3%
- By 2100
- 668,210 · -7.1%
Race, ethnicity, and origin ACS 2023
- Neighborhood character
- Predominantly White (71%)
- Race & ethnicity
- White 71% Black 13% Hispanic / Latino 10% Two or more races 8% Asian 1%
- Hispanic origin (detail)
- Mexican 7% Puerto Rican 2%
- Common ancestry
- Italian 9% Lithuanian 2% Slovak 2%
- Foreign-born
- 4% · Canada
- Languages at home
- 94% English-only · Spanish 4%
Political lean MEDSL · Jackson
- 2024 margin
- D (+19.3) · D 58.9% · R 39.5% · Other 1.6%
- 2008→2024 swing
- -6.1pp toward R · 2008: 25.4pp · 2024: 19.3pp
- All cycles
- 2024: D+19.3 2020: D+22.0 2016: D+16.6 2012: D+19.0 2008: D+25.4
Not yet ingested
- Civics
- —
Market trends
- HPI YoY
- ▼ -180.54%
- Current HPI
- 245.3636
- Rent YoY
- ▲ 5.09%
- Metro
- Kansas City, MO-KS
- State GDP YoY
- ▲ 1.84%
- F500 in state
- 20
Industry mix (Fortune 500 HQ in MO)
| Industry | F500 HQs | Revenue |
|---|---|---|
| Healthcare | 1 | $163B |
|
||
| Insurance | 1 | $21B |
|
||
| Industrial Technology | 1 | $17B |
|
||
| Retail | 1 | $16B |
|
||
| Industrial Distribution | 1 | $10B |
|
||
| Utilities | 1 | $9B |
|
||
Price history
+20.3% since first listed6 events — show timeline
- 2026-06-17 Coming Soon $199,500 Heartland MLS as Distributed by MLS Grid
- 1998-10-01 Sold (Public Records) — Public Records
- 1998-10-01 Sold (Public Records) — Public Records
- 1998-09-29 Sold (MLS) — Heartland MLS as Distributed by MLS Grid
- 1998-06-10 Listed $165,900 Heartland MLS as Distributed by MLS Grid
- 1994-02-08 Sold (Public Records) — Public Records
Property tax history
+5.3%/yrLatest (2025): $4,529 · +18.6% YoY. Source: county tax records.
Cash-flow waterfall
monthlySold comps — $/sqft
last 12 mo · ≤1 miLoading sold comps…