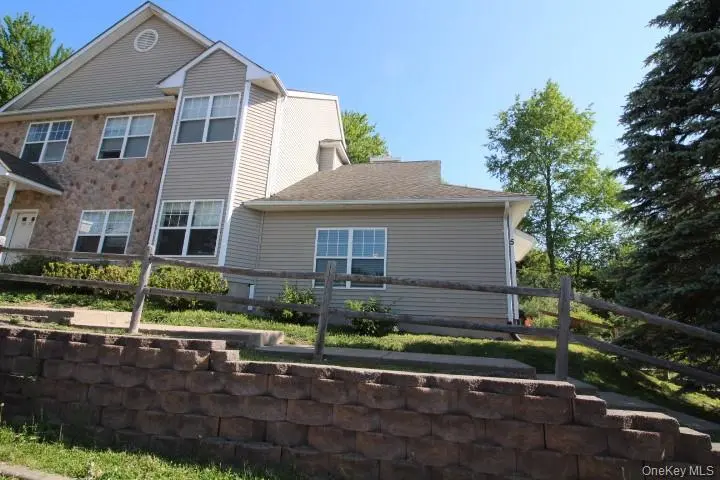
5 Timberwolf Rd Unit 10-68
Liberty, NY 12754
$189,000D-
1 bd · 1.0 ba ·
717 sqft ·
Built 2005
· Condo
· Active
· 13 DOM
Cashflow @ list (25.0% down · 7.5%)
Estimated rent
$1,610/mo
Mortgage (P&I)
−$991
Tax + insurance
−$422
HOA
−$157
Vac / Maint / Mgmt
−$338
Net cashflow
$-298/mo
Annual
$-3,573/yr
Cap rate
4.40%
Cash-on-cash
-6.75%
DSCR
0.70
1% rule
0.85%
Cash to close
$52,920
Investor read
- This is a 1-bed/1.0-bath condo listed at $189k.
- At list price, monthly cash flow is $-298 ($-4k/yr) — negative.
- To cash-flow at today's rent, offer at most $136k (27.8% below list).
- To meet the 1% rule (rent ≥ 1% of price), the offer needs to be $161k (14.8% below list).
- Only 13 days on market — expect competitive offers; lowballing is unlikely to land.
- Recommended offer: $136k (27.8% below list) — sets the bar for cash-flow.
- In year one you build about $20k of equity ($1k loan paydown + $19k appreciation (10.0% local appreciation)).
- Location reads 62/100 on livability (#890 in NY) — a middle-class / working-renter tenant base. Strengths: cost of living A+, health & safety A+, housing B+; Watch: crime D+, amenities F, commute F.
- Liberty Central School District (town): math 31% / reading 34% proficiency, ranked #569 of 590 in NY (top 96%) — families likely to look elsewhere, expect single-tenant / working-renter base with shorter leases.
- Zoned schools: Liberty Elementary School (math 27% / reading 42%, grade F, #1,577 of 2,108 statewide, top 77%, 691 students, 64% FRL); Liberty Middle School (math 12% / reading 29%, grade F, #664 of 729 statewide, top 91%, 529 students, 68% FRL); Liberty High School (math 92% / reading 70%, grade A, #495 of 1,100 statewide, top 46%, 596 students, 62% FRL) — zoned schools average 65% FRL vs 48% district-wide (16 pts higher); higher-poverty schools than district average — tighter screening recommended.
- Zoned-school proficiency averages 45% at this address vs 32% district-wide (+13 pts) — the actual schools serving this property are materially stronger than the Liberty Central School District average implies; a family-tenant draw the district grade alone would hide.
- Market conditions: 65 active listings in the ZIP; 2 comparable units currently listed for rent nearby; 739 units permitted in Sullivan County in 2024 (5 in 5+ unit buildings).
- Sullivan County population projected at -24% by 2050 — secular population decline; favor cash flow + early exit over multi-decade hold.
- By year 2, paydown + projected appreciation supports a ~$32k cash-out refi (75% LTV) — recoverable capital for the next deal without selling this one.
Questions for listing agent
- What do current leases actually rent for vs. the listed asking? Can we see a recent rent roll and the last 12 months of T-12 income?
- What does the HOA fee cover, when was the last increase, and are there any pending special assessments or reserve-fund shortfalls?
- Any open or pending special assessments — roof, HVAC, plumbing, elevator, façade? What's the per-unit balance and payoff schedule, and is the seller paying it off at close or rolling it to the buyer?
- Is there a deadline driving the sale (1031 exchange, divorce, estate, relocation)? That informs how much negotiation room exists.
- Crime grade is D in this area — have there been break-ins, vandalism, or insurance claims at this property in the last 3 years? What carrier currently insures it and at what premium?
- The area grade is low — what's the realistic commute time and amenity access for the typical tenant pool here? Any planned neighborhood developments (good or bad) we should know about?
- What's the average days-on-market for RENTAL listings here right now (not sales)? A rising rental-DOM trend means longer vacancies and softer asking-rent achievability than the comps imply.
- What's the recent tenant-quality profile in this submarket — average credit score on applications, eviction rate, late-payment / NSF rate, and stable-employment percentage? A property-management company in the area should have these aggregated.
CashFlowRE · CFR-THGKAHDX8V758S
· Data 2 days ago
cashflowre.app · 2026-05-29