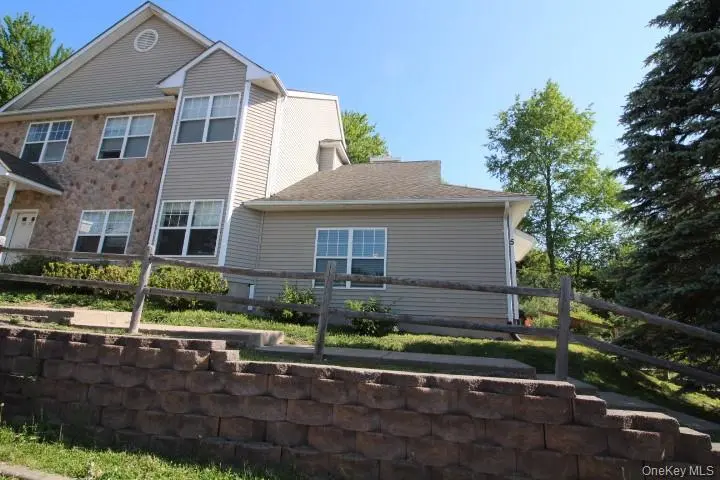
5 Timberwolf Rd Unit 10-68 · Liberty, NY
Flood risk No data
- FEMA flood zone
- —
- Chance of flooding over 30 yrs
- —
- Est. flood insurance / yr
- —
Fire risk No data
- Est. fire insurance / yr
- —
Heat risk No data
- Hot days now (above threshold)
- —
- Hot days in 30 yrs
- —
Wind risk No data
- Chance of severe wind over 30 yrs
- —
Air-quality risk No data
- Unhealthy air days now
- —
- Unhealthy air days in 30 yrs
- —
Risk factors via First Street. Map © Google.
Why this score? — see what drove the D- grade
The composite is a weighted blend of 9 inputs, each scored 0–100. Each bar is that input's sub-score; the figure is the points it added to the 100-point composite (weight × sub-score).
- Appreciation +10.0/10.0
- ARV discount +7.5/15.0
- Cash flow +6.8/30.0
- 1% rule +3.5/10.0
- Livability +3.1/5.0
- Schools +2.8/10.0
- Rent growth +2.5/5.0
- Condition / age +2.5/5.0
- DSCR +1.0/10.0
$189,000
🖨 Deal sheet 📄 Offer letter ✓ Due diligence
Listing remarks
Location. .Location. School Bell Townhouses. .. 1 Bedroom and 1 full Bathroom townhouse Just above the Liberty Middle School/High School. .great location. .minutes to shopping. . restaurants. .route 17. . casino . .water park and bethel woods . .2 hours to NYC and 30 minutes to Middletown NY. .workable floor plan so easy to navigate the space . .
Key facts
- $157 HOA
- Built 2005
- Listed 13 days
Property features AI
Finance
- HOA & community: Has association; Association fee $157 per month; Association covers common area maintenance, snow removal, and trash
Exterior
- Parking: Common off-street parking
- Utilities: Public sewer; Cable connected; Electricity connected; Sewer connected; Trash collection (private); Water connected
- Home design: Townhouse; Condominium; Measured living area
- Construction: Partial, unfinished attic; No basement
- Exterior features: Aluminum siding; Vinyl siding; Not waterfront
Interior
- Kitchen: Dishwasher; Electric cooktop; Electric oven; Oven; Refrigerator; Exhaust fan
- Bedrooms: Entry level: 1
- Bathrooms: 1 full bathroom
- Heating & cooling: Baseboard heating; No central cooling
- Interior features: First-floor bedroom; Eat-in kitchen; High-speed internet; Open floor plan; Open kitchen
- Laundry & utility: Electric water heater
Neighborhood map
What this means for you Summary
Snapshot
- This is a 1-bed/1.0-bath condo listed at $189k.
Deal economics
- At list price, monthly cash flow is $-298 ($-4k/yr) — negative.
- To cash-flow at today's rent, offer at most $136k (27.8% below list).
- To meet the 1% rule (rent ≥ 1% of price), the offer needs to be $161k (14.8% below list).
- Recommended offer: $136k (27.8% below list) — sets the bar for cash-flow.
Location & tenants
- Location reads 62/100 on livability (#890 in NY) — a middle-class / working-renter tenant base. Strengths: cost of living A+, health & safety A+, housing B+; Watch: crime D+, amenities F, commute F.
- Liberty Central School District (town): math 31% / reading 34% proficiency, ranked #569 of 590 in NY (top 96%) — families likely to look elsewhere, expect single-tenant / working-renter base with shorter leases.
- Zoned schools: Liberty Elementary School (math 27% / reading 42%, grade F, #1,577 of 2,108 statewide, top 77%, 691 students, 64% FRL); Liberty Middle School (math 12% / reading 29%, grade F, #664 of 729 statewide, top 91%, 529 students, 68% FRL); Liberty High School (math 92% / reading 70%, grade A, #495 of 1,100 statewide, top 46%, 596 students, 62% FRL) — zoned schools average 65% FRL vs 48% district-wide (16 pts higher); higher-poverty schools than district average — tighter screening recommended.
- Zoned-school proficiency averages 45% at this address vs 32% district-wide (+13 pts) — the actual schools serving this property are materially stronger than the Liberty Central School District average implies; a family-tenant draw the district grade alone would hide.
- Market conditions: 65 active listings in the ZIP; 2 comparable units currently listed for rent nearby; 739 units permitted in Sullivan County in 2024 (5 in 5+ unit buildings).
Forward outlook
- In year one you build about $20k of equity ($1k loan paydown + $19k appreciation (10.0% local appreciation)).
- Sullivan County population projected at -24% by 2050 — secular population decline; favor cash flow + early exit over multi-decade hold.
- By year 2, paydown + projected appreciation supports a ~$32k cash-out refi (75% LTV) — recoverable capital for the next deal without selling this one.
Negotiation context
- Only 13 days on market — expect competitive offers; lowballing is unlikely to land.
Questions for the listing agent
- What do current leases actually rent for vs. the listed asking? Can we see a recent rent roll and the last 12 months of T-12 income?
- What does the HOA fee cover, when was the last increase, and are there any pending special assessments or reserve-fund shortfalls?
- Any open or pending special assessments — roof, HVAC, plumbing, elevator, façade? What's the per-unit balance and payoff schedule, and is the seller paying it off at close or rolling it to the buyer?
- Is there a deadline driving the sale (1031 exchange, divorce, estate, relocation)? That informs how much negotiation room exists.
- Crime grade is D in this area — have there been break-ins, vandalism, or insurance claims at this property in the last 3 years? What carrier currently insures it and at what premium?
- The area grade is low — what's the realistic commute time and amenity access for the typical tenant pool here? Any planned neighborhood developments (good or bad) we should know about?
- What's the average days-on-market for RENTAL listings here right now (not sales)? A rising rental-DOM trend means longer vacancies and softer asking-rent achievability than the comps imply.
- What's the recent tenant-quality profile in this submarket — average credit score on applications, eviction rate, late-payment / NSF rate, and stable-employment percentage? A property-management company in the area should have these aggregated.
- How much new apartment / multifamily construction is in the pipeline within 1–3 miles? Heavy new supply (>2% of stock underway) typically softens rents 12–24 months out; light construction supports rent growth.
Investment metrics
- 1% rule
- 0.85% ✗
- Cap rate
- 4.40%
- Cash-on-cash
- -6.75%
- DSCR
- 0.70
- GRM
- 9.8
CMA / ARV
No comps found within radius.
Projected returns pro-forma
10.0% appreciation · 3.0% rent growth · sell at horizon
- IRR
- 19.5%
- Equity multiple
- 2.59×
- Total profit
- $84,155
- Equity at exit
- $170,266
- IRR
- 18.0%
- Equity multiple
- 5.97×
- Total profit
- $263,107
- Equity at exit
- $367,185
Cash invested: $52,920 (down + closing). Projections, not guarantees.
Landlord ↔ Tenant lean methodology
- Overall (STATE)
- 15 Strongly Tenant-Friendly
- State New York
- 15 Strongly Tenant-Friendly · D+10
- County
- — inherits STATE
- City
- — inherits STATE
ZIP-level market 12754
- Home prices YoY
- 28.0%
- Active inventory
- 65
- Price-to-rent
- 9.8×
Monthly cashflow live
- Estimated rent
- $1,610 medium interval (Pro) →
- Mortgage (P&I)
- −$991
- Tax from tax record
- −$343 /mo · $4,113/yr
- Insurance
- −$79
- HOA
- −$157
- Vacancy / Maint / Mgmt
- −$338
- Net cashflow
- $-298
Break-even live
UW: 25.0% down · 7.5% · 30yr · 1.5% tax · 5.0% vac · 8.0% maint · 8.0% mgmt
Financing live
Cash to close
- Down payment
- $47,250
- Closing costs
- $5,670
- Reserves months
- —
- Total cash needed
- —
Loan-product check · same deal, 3 products live
Conventional
25% down · 7.5% · 30yr
- Down + closing
- —
- Monthly P&I
- —
- Monthly cashflow
- —
- DSCR
- —
- Eligible?
- —
Personal DTI + credit; lowest rate.
DSCR
20% down · 8.5% · 30yr
- Down + closing
- —
- Monthly P&I
- —
- Monthly cashflow
- —
- DSCR
- —
- Eligible?
- —
No personal income docs; deal must DSCR.
Hard money
10% down · 12.0% · 12mo
- Down + closing
- —
- Monthly P&I
- —
- Monthly cashflow
- —
- DSCR
- —
- Eligible?
- —
Short-term bridge; refi at stabilization.
Rent comps 2 comps
| Address | Beds | Baths | Sqft | Rent | $/sqft | DOM | Units | Dist |
|---|---|---|---|---|---|---|---|---|
| 221 Chestnut St Unit 3 Liberty, NY | 2.0 | 1.0 | 750 | $1,750 | $2.33 | 23d | 1 | 0.54mi |
| 221 Chestnut St Unit 1 Liberty, NY | 2.0 | 1.0 | 600 | $1,450 | $2.42 | 23d | 1 | 0.54mi |
HOA detail condo
- Monthly dues
- $157 · $1,884/yr
- Likely covers
- water
- Assessments
- None detected in remarks — confirm with the listing agent.
Listing history 12 events
-
2026-06-18days on market $189,000 Active 13 DOM
-
2026-06-17days on market $189,000 Active 12 DOM
-
2026-06-16days on market $189,000 Active 11 DOM
-
2026-06-15days on market $189,000 Active 10 DOM
-
2026-06-14days on market $189,000 Active 8 DOM
-
2026-06-13days on market $189,000 Active 7 DOM
-
2026-06-10days on market $189,000 Active 5 DOM
-
2026-06-09days on market $189,000 Active 4 DOM
-
2026-06-09remarks 349-char remark
-
2026-06-08days on market $189,000 Active 3 DOM
-
2026-06-07remarks 313-char remark
-
2026-06-07$189,000 Active 2 DOM
ⓘ Source: listings_history table (triggers on properties + properties_extension) + one-shot
backfill from property_details.listing_events for pre-trigger history.
Tax reassessment forecast NY · Partial reset (capped growth)
- Current annual tax
- $4,113 · $343/mo
- Projected year-2 tax
- $4,113 · $343/mo
- Expected delta
- $0/yr ($0/mo · 0.0%)
ⓘ Screening estimate from a state-policy table — verify with the county assessor before closing.
Nearby sold comps map
Loading sold comps map…
Walkable amenities ~0.75 mi
Loading nearby amenities…
Taxation est. · year 1
- Rental income
- $19,320
- − Mortgage interest
- −$10,587
- − Property taxes
- −$4,113
- − Insurance
- −$945
- − Repairs & maintenance
- −$1,546
- − Management
- −$1,546
- − HOA
- −$1,884
- − Depreciation
- −$5,498
- Taxable loss
- −$6,799
- Est. tax savings @ 24.0%
- +$1,632
- After-tax cash flow
- $-1,942/yr
For passive investors: Depreciation is non-cash, so a rental often shows a tax loss while cash-flowing — sheltering income. Rental losses are passive: they offset passive income freely, and up to $25,000/yr can offset ordinary (W-2) income if you actively participate and your MAGI is under $100k (phasing out to $0 by $150k); unused losses carry forward. On sale, claimed depreciation is recaptured at up to 25%, and gains may owe capital-gains tax (a 1031 exchange can defer both). Figures are a year-1 estimate at your 24.0% rate — not tax advice; consult a CPA.
Schools (NCES district)
- District
- Liberty Central School District
- NCES district ID
- 3617220
- Math proficiency
- 31% ▼ -8.00%
- Reading proficiency
- 34% ▼ -4.00%
- Median HH income
- $43,542
- Composite
- 27.65/100
- National rank
- #6920
- State rank
- #569 of 590 in NY
Livability — Liberty
- Score
- 62/100
- State rank
- #890
- US rank
- #17254
Category grades
Schools grade is shown separately in the Schools card above.
Census & demographics
- Census place
- Liberty, NY
- City population
- 8,525
- Population (ZIP)
- 8,525
Population outlook (Sullivan County) Hauer SSP2
- Today (2025)
- 68,974 people
- By 2030
- 65,609 · -4.9%
- By 2040
- 58,878 · -14.6%
- By 2050
- 52,500 · -23.9%
- By 2075
- 39,941 · -42.1%
- By 2100
- 28,880 · -58.1%
Race, ethnicity, and origin ACS 2023
- Neighborhood character
- Diverse neighborhood (Simpson 0.56)
- Race & ethnicity
- White 56% Hispanic / Latino 36% Two or more races 8% Black 4% Asian 2% Native American 1%
- Hispanic origin (detail)
- Mexican 3% Puerto Rican 7% Dominican 2%
- Common ancestry
- Romanian 3% Lithuanian 2% Scotch-Irish 1%
- Foreign-born
- 22% · Canada, Dominican Republic, Jamaica
- Languages at home
- 71% English-only · Spanish 25% Other Indo-European 2% French/Haitian/Cajun 1%
Political lean MEDSL · Sullivan
- 2024 margin
- R (+16.7) · D 41.6% · R 58.4%
- 2008→2024 swing
- -26.2pp toward R · 2008: 9.5pp · 2024: -16.7pp
- All cycles
- 2024: R+16.7 2020: R+9.2 2016: R+13.7 2012: D+10.4 2008: D+9.5
Not yet ingested
- Civics
- —
Market trends
- HPI YoY
- ▲ 100.10%
- Current HPI
- 457.3342
- Rent YoY
- —
- Metro
- —
- State GDP YoY
- ▲ 2.60%
- F500 in state
- 92
Industry mix (Fortune 500 HQ in NY)
| Industry | F500 HQs | Revenue |
|---|---|---|
| Financial Services | 10 | $950B |
|
||
| Consumer Goods | 9 | $162B |
|
||
| Insurance | 4 | $225B |
|
||
| Telecommunications | 2 | $144B |
|
||
| Pharmaceuticals | 2 | $112B |
|
||
| Media / Entertainment | 2 | $69B |
|
||
Price history
1 event — show timeline
- 2026-06-05 Listed $189,000 OneKey® MLS as Distributed by MLS Grid
Property tax history
+1.1%/yrLatest (2025): $4,113 · +7.8% YoY. Source: county tax records.
Cash-flow waterfall
monthlySold comps — $/sqft
last 12 mo · ≤1 miLoading sold comps…