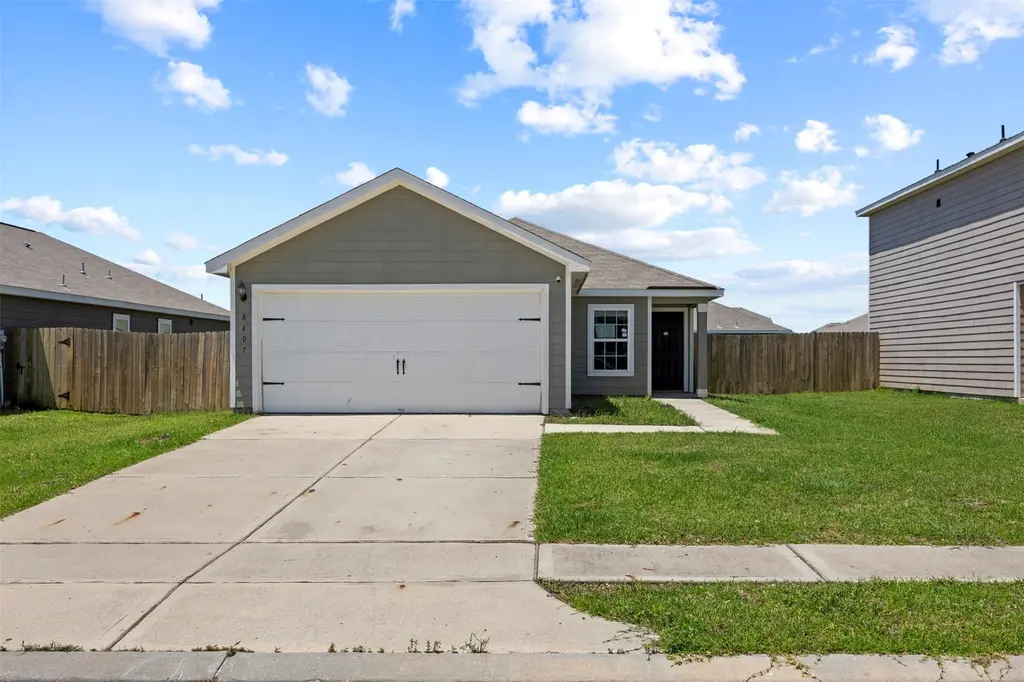
8407 Bermuda Blue Rd
Cove, TX 77523
$217,000C-
3 bd · 2.0 ba ·
1,335 sqft ·
Built 2021
· SingleFamily
· Active
· 29 DOM
Cashflow @ list (25.0% down · 7.5%)
Estimated rent
$2,009/mo
Mortgage (P&I)
−$1,138
Tax + insurance
−$394
HOA
−$32
Vac / Maint / Mgmt
−$422
Net cashflow
$23/mo
Annual
$280/yr
Cap rate
6.42%
Cash-on-cash
0.46%
DSCR
1.02
1% rule
0.93%
Cash to close
$60,760
Investor read
- This is a 3-bed/2.0-bath single-family listed at $217k. Condition is rated good.
- At list price, monthly cash flow is $23 ($280/yr) — positive.
- The deal already cash-flows at list — no discount required.
- To meet the 1% rule (rent ≥ 1% of price), the offer needs to be $201k (7.4% below list).
- It's been on market 29 days — a 2% lower offer ($214k) is reasonable based on typical stale-listing flexibility.
- Recommended offer: $201k (7.4% below list) — sets the bar for 1% rule.
- Local home prices are declining (-3.0%/yr); year-one equity from $2k of loan paydown is wiped out by about $7k of value loss. Plan a longer hold.
- Location reads 64/100 on livability (#766 in TX) — a middle-class / working-renter tenant base. Strengths: employment A+, housing A+, crime A; Watch: amenities F, commute F, health & safety F.
- Barbers Hill ISD (rural): math 72% / reading 65% proficiency, ranked #12 of 826 in TX (top 2%) — acceptable for families but not a draw, mixed tenant base, ~2y average lease.
- Zoned schools: Barbers Hill El South (math 68% / reading 62%, grade B+, #246 of 4,322 statewide, top 6%, 883 students, 37% FRL); Barbers Hill Middle South (math 77% / reading 63%, grade A, #58 of 1,662 statewide, top 4%, 636 students, 0% FRL); Barbers Hill H S (math 70% / reading 74%, grade B+, #95 of 1,632 statewide, top 7%, 1,972 students, 0% FRL) — zoned schools average 12% FRL vs 28% district-wide (16 pts lower); this property's tenant base skews higher-income than the district average.
- Market conditions: Rents rising (+3.4%/yr); 776 active listings in the ZIP; 10 comparable units currently listed for rent nearby; rentals at typical pace (median 20d on market — plan ~3-4 weeks tenant-placement turnaround); high-income renter base; 629 units permitted in Chambers County in 2024 (0 in 5+ unit buildings).
- Chambers County population projected at +46% by 2050 — long-run rental-demand tailwind backs the buy-and-hold thesis.
- 4 sale attempts since 3y ago with the ask held roughly flat each time — persistent listings suggest the price (not the market) is what's stuck; bring a comps-based counter.
- Climate carrying-cost: severe wind risk, 99% chance of damaging wind over 30y; extreme-heat days projected 7→26/yr by 2055 (HVAC capex compounding) — expect insurance premiums to compound above CPI over the hold.
- Cap rate 6.4% vs local median 5.3% in Cove — meaningfully above typical; check what's discounted (condition, days-on-market, listing class) to confirm the premium yield is real.
Questions for listing agent
- What does the HOA fee cover, when was the last increase, and are there any pending special assessments or reserve-fund shortfalls?
- Is there a deadline driving the sale (1031 exchange, divorce, estate, relocation)? That informs how much negotiation room exists.
- Schools are D-rated, which usually means shorter tenancies and higher turnover. Who's the typical renter profile here, and what's been the actual vacancy rate?
- What's the average days-on-market for RENTAL listings here right now (not sales)? A rising rental-DOM trend means longer vacancies and softer asking-rent achievability than the comps imply.
- What's the recent tenant-quality profile in this submarket — average credit score on applications, eviction rate, late-payment / NSF rate, and stable-employment percentage? A property-management company in the area should have these aggregated.
- How much new for-sale + rental construction is in the pipeline within 1–3 miles? Heavy new supply typically softens prices + rents 12–24 months out; constrained supply supports both.
CashFlowRE · CFR-TK3C2KAFJCH2KJ
· Data 2 days ago
cashflowre.app · 2026-05-29