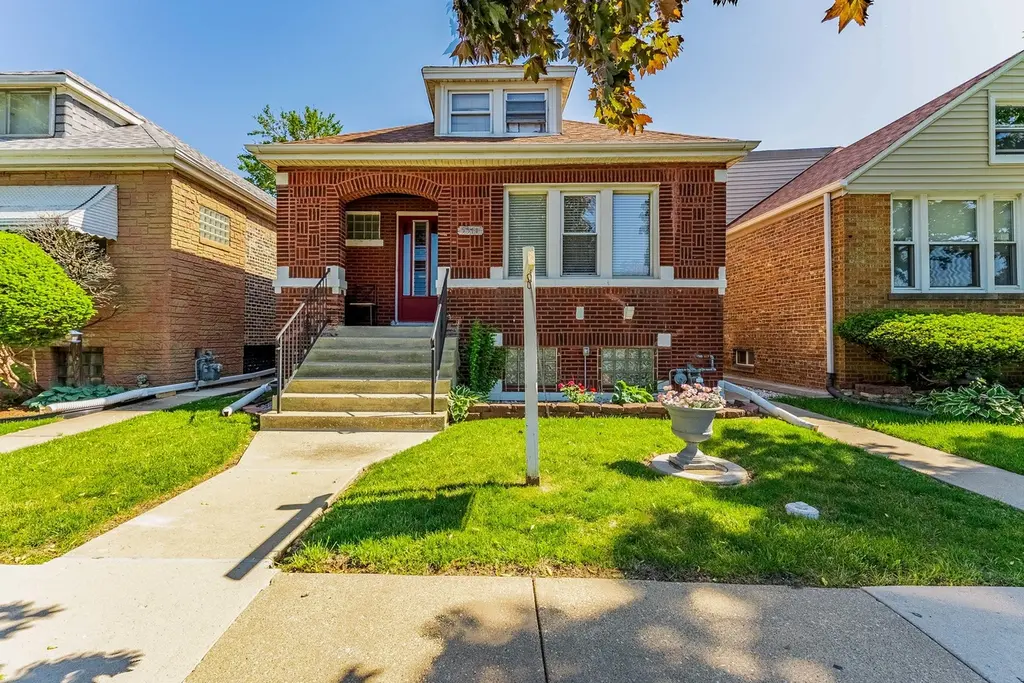
5511 W 31st St
Cicero, IL 60804
$339,999B-
3 bd · 2.0 ba ·
2,071 sqft ·
Built 1928
· MultiFamily
· Active
· 14 DOM
Cashflow @ list (25.0% down · 7.5%)
Estimated rent
$6,976/mo
Mortgage (P&I)
−$1,783
Tax + insurance
−$364
HOA
−$0
Vac / Maint / Mgmt
−$1,465
Net cashflow
$3,364/mo
Annual
$40,371/yr
Cap rate
18.17%
Cash-on-cash
42.41%
DSCR
2.89
1% rule
2.05%
Cash to close
$95,200
Investor read
- This is a 3-bed/2.0-bath multifamily listed at $340k.
- At list price, monthly cash flow is $3k ($40k/yr) — positive.
- The deal already cash-flows at list — no discount required.
- Meets the 1% rule at list price ($7k rent vs $340k).
- Only 14 days on market — expect competitive offers; lowballing is unlikely to land.
- Local home prices are declining (-3.0%/yr); year-one equity from $2k of loan paydown is wiped out by about $10k of value loss. Plan a longer hold.
- Location reads 82/100 on livability (#77 in IL, #1,276 nationally) — a professional / high-income tenant draw. Strengths: commute A+, cost of living A+, housing A+; Watch: schools F.
- J S Morton Hsd 201 (suburban): math 9% / reading 14% proficiency, ranked #557 of 620 in IL (top 90%) — low school quality limits family demand, transient renter base, plan for 1-2y turnover.
- Watch-outs: built in 1928 — expect roof / HVAC / electrical / plumbing capex.
- Market conditions: Rents rising (+2.4%/yr); 103 active listings in the ZIP; 5 comparable units currently listed for rent nearby; rentals at typical pace (median 21d on market — plan ~3-4 weeks tenant-placement turnaround); 6,272 units permitted in Cook County in 2024 (4,658 in 5+ unit buildings).
- 2 sale attempts with the ask held roughly flat each time — persistent listings suggest the price (not the market) is what's stuck; bring a comps-based counter.
- Current owner paid $55k; list at $340k implies a 518% gain — meaningful room to come down on a strong offer.
- At projected returns (-3.0% appreciation + 2.4% rent growth), your $95k cash investment doubles in ~3 years — after that, you're playing with house money.
- Cap rate 18.2% vs local median 4.6% in Cicero — top-decile yield for the area; either an underpriced asset or a hidden risk that comps aren't pricing in. Stress-test before assuming the spread holds.
- At $6,976/mo this rent would consume 118% of the median local household income ($71k/yr) (locally 2178% of renters already pay >50% of income on rent) — very limited rent-growth headroom before tenants either downsize or default.
Questions for listing agent
- Built in 1928 — when were the roof, HVAC, electrical panel, plumbing, and water heater last replaced?
- Is there a deadline driving the sale (1031 exchange, divorce, estate, relocation)? That informs how much negotiation room exists.
- Schools are F-rated, which usually means shorter tenancies and higher turnover. Who's the typical renter profile here, and what's been the actual vacancy rate?
- What's the average days-on-market for RENTAL listings here right now (not sales)? A rising rental-DOM trend means longer vacancies and softer asking-rent achievability than the comps imply.
- What's the recent tenant-quality profile in this submarket — average credit score on applications, eviction rate, late-payment / NSF rate, and stable-employment percentage? A property-management company in the area should have these aggregated.
- How much new apartment / multifamily construction is in the pipeline within 1–3 miles? Heavy new supply (>2% of stock underway) typically softens rents 12–24 months out; light construction supports rent growth.
CashFlowRE · CFR-TK919C3TKB6S3H
· Data 2 days ago
cashflowre.app · 2026-05-29