 Multi-family
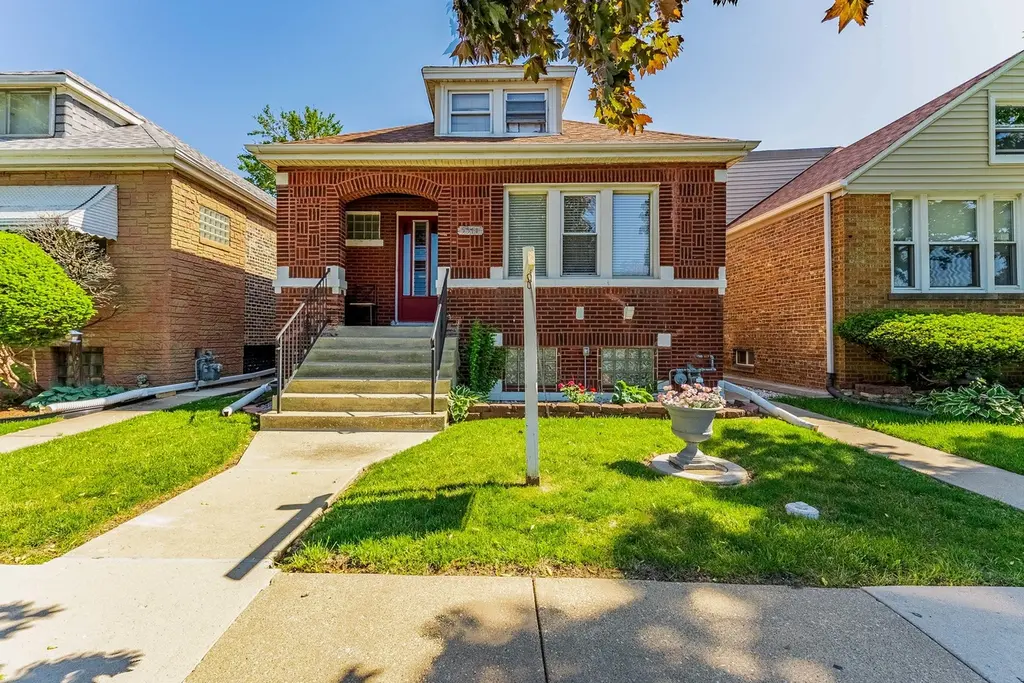
5511 W 31st St · Cicero, IL
Flood risk 1/10 · Minimal
- FEMA flood zone
- X (unshaded)
- Chance of flooding over 30 yrs
- 0.0%
- Est. flood insurance / yr
- $507 – $1,088
Fire risk 1/10 · Minimal
- Est. fire insurance / yr
- $804 – $1,492
Heat risk 3/10 · Minor
- Hot days now (above 99°F)
- 7 days/yr
- Hot days in 30 yrs
- 15 days/yr
Wind risk 2/10 · Minimal
- Chance of severe wind over 30 yrs
- 0.0%
Air-quality risk 4/10 · Minor
- Unhealthy air days now
- 3 days/yr
- Unhealthy air days in 30 yrs
- 5 days/yr
Risk factors via First Street. Map © Google.
Why this score? — see what drove the B- grade
The composite is a weighted blend of 9 inputs, each scored 0–100. Each bar is that input's sub-score; the figure is the points it added to the 100-point composite (weight × sub-score).
- Cash flow +30.0/30.0
- 1% rule +10.0/10.0
- DSCR +10.0/10.0
- ARV discount +7.5/15.0
- Livability +4.1/5.0
- Rent growth +3.1/5.0
- Condition / age +2.5/5.0
- Schools +1.1/10.0
- Appreciation +0.0/10.0
$339,999
🖨 Deal sheet 📄 Offer letter ✓ Due diligence
Multi-family units
County records classify this as Multi-Family (5+ Unit). Listing-text estimate: 1 unit. estimate disagrees with records
5+ unit building — per-unit beds/baths from public records are typically unavailable; the breakdown below (if shown) is an estimate from the listing text.
Listing remarks MLS
There are no remarks available.
Key facts
- Access to parks
- Access to shopping
- Functional layout
Tags
Property features AI
Exterior
- Utilities: Electric: Separate meters
- Home design: Multi-family property (5+ classification); Brick construction; Composition roof
- Construction: Brick exterior; Composition roof
- Exterior features: Lot dimensions approximately 25 x 150
Interior
- Bedrooms: Unit 1: 2 bedrooms; Unit 2 (each): 1 bedroom (2 units)
- Bathrooms: Unit 1: 1 full bathroom; Unit 2 (each): 1 full bathroom
- Heating & cooling: Gas heating; Window air conditioning units
- Interior features: Unfinished basement
Neighborhood map
What this means for you Summary
Snapshot
- This is a 3-bed/2.0-bath multifamily listed at $340k.
Deal economics
- At list price, monthly cash flow is $3k ($40k/yr) — positive.
- The deal already cash-flows at list — no discount required.
- Meets the 1% rule at list price ($7k rent vs $340k).
- Cap rate 18.2% vs local median 4.6% in Cicero — top-decile yield for the area; either an underpriced asset or a hidden risk that comps aren't pricing in. Stress-test before assuming the spread holds.
Location & tenants
- Location reads 82/100 on livability (#77 in IL, #1,276 nationally) — a professional / high-income tenant draw. Strengths: commute A+, cost of living A+, housing A+; Watch: schools F.
- J S Morton Hsd 201 (suburban): math 9% / reading 14% proficiency, ranked #557 of 620 in IL (top 90%) — low school quality limits family demand, transient renter base, plan for 1-2y turnover.
- Market conditions: Rents rising (+2.4%/yr); 103 active listings in the ZIP; 5 comparable units currently listed for rent nearby; rentals at typical pace (median 21d on market — plan ~3-4 weeks tenant-placement turnaround); 6,272 units permitted in Cook County in 2024 (4,658 in 5+ unit buildings).
- At $6,976/mo this rent would consume 118% of the median local household income ($71k/yr) (locally 2178% of renters already pay >50% of income on rent) — very limited rent-growth headroom before tenants either downsize or default.
Forward outlook
- Local home prices are declining (-3.0%/yr); year-one equity from $2k of loan paydown is wiped out by about $10k of value loss. Plan a longer hold.
- At projected returns (-3.0% appreciation + 2.4% rent growth), your $95k cash investment doubles in ~3 years — after that, you're playing with house money.
Negotiation context
- Only 14 days on market — expect competitive offers; lowballing is unlikely to land.
- 2 sale attempts with the ask held roughly flat each time — persistent listings suggest the price (not the market) is what's stuck; bring a comps-based counter.
- Current owner paid $55k; list at $340k implies a 518% gain — meaningful room to come down on a strong offer.
Risks & watch-outs
- Watch-outs: built in 1928 — expect roof / HVAC / electrical / plumbing capex.
Questions for the listing agent
- Built in 1928 — when were the roof, HVAC, electrical panel, plumbing, and water heater last replaced?
- Is there a deadline driving the sale (1031 exchange, divorce, estate, relocation)? That informs how much negotiation room exists.
- Schools are F-rated, which usually means shorter tenancies and higher turnover. Who's the typical renter profile here, and what's been the actual vacancy rate?
- What's the average days-on-market for RENTAL listings here right now (not sales)? A rising rental-DOM trend means longer vacancies and softer asking-rent achievability than the comps imply.
- What's the recent tenant-quality profile in this submarket — average credit score on applications, eviction rate, late-payment / NSF rate, and stable-employment percentage? A property-management company in the area should have these aggregated.
- How much new apartment / multifamily construction is in the pipeline within 1–3 miles? Heavy new supply (>2% of stock underway) typically softens rents 12–24 months out; light construction supports rent growth.
Investment metrics
- 1% rule
- 2.05% ✓
- Cap rate
- 18.17%
- Cash-on-cash
- 42.41%
- DSCR
- 2.89
- GRM
- 4.1
CMA / ARV
No comps found within radius.
Projected returns pro-forma
-3.0% appreciation · 2.43% rent growth · sell at horizon
- IRR
- 38.5%
- Equity multiple
- 2.63×
- Total profit
- $155,177
- Equity at exit
- $50,695
- IRR
- 44.7%
- Equity multiple
- 5.15×
- Total profit
- $394,815
- Equity at exit
- $29,397
Cash invested: $95,200 (down + closing). Projections, not guarantees.
Landlord ↔ Tenant lean methodology
- Overall (STATE)
- 43 Moderately Tenant-Leaning
- State Illinois
- 43 Moderately Tenant-Leaning · D+7
- County
- — inherits STATE
- City
- — inherits STATE
ZIP-level market 60804
- Rents YoY
- 2.4%
- Active inventory
- 103
- Price-to-rent
- 24.4×
Monthly cashflow live
- Estimated rent
- $6,976 medium interval (Pro) →
- Mortgage (P&I)
- −$1,783
- Tax from tax record
- −$222 /mo · $2,666/yr
- Insurance
- −$142
- HOA
- −$0
- Vacancy / Maint / Mgmt
- −$1,465
- Net cashflow
- $3,364
Break-even live
6-unit breakdown (identical units grouped — click to expand)
| Units | Beds | Baths | Est. rent |
|---|---|---|---|
| 6× units | 2 | 1 | $6,978 |
| #1 | 2 | 1 | $1,163 |
| #2 | 2 | 1 | $1,163 |
| #3 | 2 | 1 | $1,163 |
| #4 | 2 | 1 | $1,163 |
| #5 | 2 | 1 | $1,163 |
| #6 | 2 | 1 | $1,163 |
| Total (6 units) | $6,976 | ||
UW: 25.0% down · 7.5% · 30yr · 1.5% tax · 5.0% vac · 8.0% maint · 8.0% mgmt
Financing live
Cash to close
- Down payment
- $85,000
- Closing costs
- $10,200
- Reserves months
- —
- Total cash needed
- —
Loan-product check · same deal, 3 products live
Conventional
25% down · 7.5% · 30yr
- Down + closing
- —
- Monthly P&I
- —
- Monthly cashflow
- —
- DSCR
- —
- Eligible?
- —
Personal DTI + credit; lowest rate.
DSCR
20% down · 8.5% · 30yr
- Down + closing
- —
- Monthly P&I
- —
- Monthly cashflow
- —
- DSCR
- —
- Eligible?
- —
No personal income docs; deal must DSCR.
Hard money
10% down · 12.0% · 12mo
- Down + closing
- —
- Monthly P&I
- —
- Monthly cashflow
- —
- DSCR
- —
- Eligible?
- —
Short-term bridge; refi at stabilization.
Rent comps 5 comps
| Address | Beds | Baths | Sqft | Rent | $/sqft | DOM | Units | Dist |
|---|---|---|---|---|---|---|---|---|
| 3222 S 52nd Ct Cicero, IL | 3.0 | 2.0 | 1627 | $5,850 | $3.60 | 1d | 1 | 0.39mi |
| 3633 S 57th Ct Cicero, IL | 3.0 | 2.5 | 1708 | $2,500 | $1.46 | 20d | 1 | 0.73mi |
| 5529 W 22nd Pl #2 Cicero, IL | 3.0 | 1.0 | 1400 | $1,900 | $1.36 | 24d | 1 | 0.96mi |
| 2432 Elmwood Ave Berwyn, IL | 3.0 | 2.0 | 1657 | $2,000 | $1.21 | 17d | 1 | 1.36mi |
| 2103 Highland Ave #2 Berwyn, IL | 3.0 | 1.0 | 2264 | $1,995 | $0.88 | 24d | 1 | 1.49mi |
Listing history 9 events
-
2026-06-18days on market $339,999 Active 14 DOM
-
2026-06-17days on market $339,999 Active 13 DOM
-
2026-06-16days on market $339,999 Active 12 DOM
-
2026-06-15days on market $339,999 Active 11 DOM
-
2026-06-13days on market $339,999 Active 9 DOM
-
2026-06-09days on market $339,999 Active 5 DOM
-
2026-06-08days on market $339,999 Active 4 DOM
-
2026-06-07days on market $339,999 Active 3 DOM
-
2026-06-04$339,999 Active 1 DOM
Show marketing remark (31 chars)
There are no remarks available.
ⓘ Source: listings_history table (triggers on properties + properties_extension) + one-shot
backfill from property_details.listing_events for pre-trigger history.
Tax reassessment forecast IL · Partial reset (capped growth)
- Current annual tax
- $2,666 · $222/mo
- Projected year-2 tax
- $5,192 · $433/mo
- Expected delta
- +$2,526/yr (+$211/mo · 94.8%)
ⓘ Screening estimate from a state-policy table — verify with the county assessor before closing.
Climate risk First Street
- Flood 1/10 Low FEMA zone X (unshaded) · 0% chance over 30 yrs
- Wildfire 1/10 Low
- Heat 3/10 Moderate 7 d/yr ≥99°F today · 15 d/yr by 30 yrs out
- Wind 2/10 Low 0% chance of damaging wind over 30 yrs
- Air quality 4/10 Moderate 3 unhealthy d/yr today · 5 by 30 yrs out
Nearby sold comps map
Loading sold comps map…
Walkable amenities ~0.75 mi
Loading nearby amenities…
Taxation est. · year 1
- Rental income
- $83,712
- − Mortgage interest
- −$19,045
- − Property taxes
- −$2,666
- − Insurance
- −$1,700
- − Repairs & maintenance
- −$6,697
- − Management
- −$6,697
- − Depreciation
- −$9,891
- Taxable income
- $37,016
- Est. tax owed @ 24.0%
- −$8,884
- After-tax cash flow
- $31,487/yr
For passive investors: Depreciation is non-cash, so a rental often shows a tax loss while cash-flowing — sheltering income. Rental losses are passive: they offset passive income freely, and up to $25,000/yr can offset ordinary (W-2) income if you actively participate and your MAGI is under $100k (phasing out to $0 by $150k); unused losses carry forward. On sale, claimed depreciation is recaptured at up to 25%, and gains may owe capital-gains tax (a 1031 exchange can defer both). Figures are a year-1 estimate at your 24.0% rate — not tax advice; consult a CPA.
Schools (NCES district)
- District
- J S Morton Hsd 201
- NCES district ID
- 1726880
- Math proficiency
- 9% ▲ 1.00%
- Reading proficiency
- 14% ▼ -1.00%
- Median HH income
- $48,698
- Composite
- 10.73/100
- National rank
- #9768
- State rank
- #557 of 620 in IL
Livability — Cicero
- Score
- 82/100
- State rank
- #77
- US rank
- #1276
Category grades
Schools grade is shown separately in the Schools card above.
Census & demographics
- Census place
- Cicero, IL
- County
- Cook County · 4,486,803 people
- City population
- 82,797
- Metro
- Chicago-Naperville-Elgin, IL-IN-WI
- Population (ZIP)
- 82,797
- Household income
- $70,842
- Rent vs Own
- Severe rent burden
- 2178.0
Population outlook (Cook County) Hauer SSP2
- Today (2025)
- 5,347,519 people
- By 2030
- 5,357,703 · +0.2%
- By 2040
- 5,324,924 · -0.4%
- By 2050
- 5,230,762 · -2.2%
- By 2075
- 4,785,735 · -10.5%
- By 2100
- 4,188,836 · -21.7%
Race, ethnicity, and origin ACS 2023
- Neighborhood character
- Predominantly Hispanic (89%)
- Race & ethnicity
- Hispanic / Latino 89% Two or more races 17% White 7% Black 3% Native American 2%
- Hispanic origin (detail)
- Mexican 80% Puerto Rican 3%
- Common ancestry
- Romanian 2%
- Foreign-born
- 40% · Canada, Jamaica
- Languages at home
- 18% English-only · Spanish 80%
Political lean MEDSL · Cook
- 2024 margin
- Solid D (+42.0) · D 70.4% · R 28.4% · Other 1.2%
- 2008→2024 swing
- -11.4pp toward R · 2008: 53.4pp · 2024: 42.0pp
- All cycles
- 2024: D+42.0 2020: D+50.3 2016: D+53.0 2012: D+49.4 2008: D+53.4
Not yet ingested
- Civics
- —
Market trends
- HPI YoY
- ▼ -165.38%
- Current HPI
- 262.83
- Rent YoY
- ▲ 2.43%
- Metro
- Chicago-Naperville-Elgin, IL-IN-WI
- State GDP YoY
- ▲ 1.59%
- F500 in state
- 60
Industry mix (Fortune 500 HQ in IL)
| Industry | F500 HQs | Revenue |
|---|---|---|
| Insurance | 4 | $201B |
|
||
| Consumer Goods | 4 | $87B |
|
||
| Industrial Machinery | 3 | $64B |
|
||
| Healthcare | 2 | $55B |
|
||
| Retail / Pharmacy | 1 | $148B |
|
||
| Agriculture / Food | 1 | $86B |
|
||
Price history
+518.2% since first listed4 events — show timeline
- 2026-06-04 Listed $339,999 MRED as Distributed by MLS Grid
- 2026-06-04 Listing Removed — MRED as Distributed by MLS Grid
- 2026-06-03 Listed — MRED as Distributed by MLS Grid
- 1986-08-01 Sold (Public Records) $55,000 Public Records
Property tax history
-1.3%/yrLatest (2023): $2,666 · -24.9% YoY. Source: county tax records.
Cash-flow waterfall
monthlySold comps — $/sqft
last 12 mo · ≤1 miLoading sold comps…