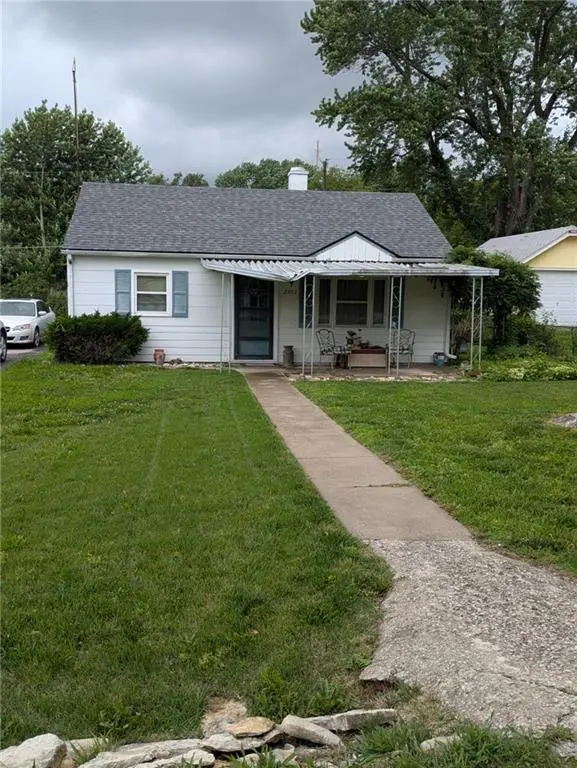
2202 S 37th St
Kansas City, KS 66106
$150,000B-
3 bd · 1.5 ba ·
1,152 sqft ·
Built 1952
· SingleFamily
· Pending
· 1 DOM
Cashflow @ list (25.0% down · 7.5%)
Estimated rent
$1,852/mo
Mortgage (P&I)
−$787
Tax + insurance
−$313
HOA
−$0
Vac / Maint / Mgmt
−$389
Net cashflow
$364/mo
Annual
$4,363/yr
Cap rate
9.20%
Cash-on-cash
10.39%
DSCR
1.46
1% rule
1.23%
Cash to close
$42,000
Investor read
- This is a 3-bed/1.5-bath single-family listed at $150k.
- At list price, monthly cash flow is $364 ($4k/yr) — positive.
- The deal already cash-flows at list — no discount required.
- Meets the 1% rule at list price ($2k rent vs $150k).
- Only 1 days on market — expect competitive offers; lowballing is unlikely to land.
- Local home prices are declining (-3.0%/yr); year-one equity from $1k of loan paydown is wiped out by about $4k of value loss. Plan a longer hold.
- Location reads 72/100 on livability (#103 in KS) — a middle-class / working-renter tenant base. Strengths: commute A+, cost of living A+, housing A+; Watch: crime F, employment D-.
- Turner-Kansas City (urban): math 15% / reading 22% proficiency, ranked #161 of 169 in KS (top 95%) — low school quality limits family demand, transient renter base, plan for 1-2y turnover; 64% free/reduced lunch — lower-income household profile, screen leases tightly.
- Zoned schools: Junction Elementary (math 37% / reading 42%, grade F, #321 of 684 statewide, top 52%, 245 students, 69% FRL); Turner High (math 5% / reading 8%, grade F, #318 of 327 statewide, top 97%, 1,171 students, 71% FRL).
- Watch-outs: built in 1952 — expect roof / HVAC / electrical / plumbing capex.
- Market conditions: 94 active listings in the ZIP; 4 comparable units currently listed for rent nearby; rentals at typical pace (median 18d on market — plan ~3-4 weeks tenant-placement turnaround); 369 units permitted in Wyandotte County in 2024 (236 in 5+ unit buildings).
- Wyandotte County population projected at +17% by 2050 — long-run rental-demand tailwind backs the buy-and-hold thesis.
- Cap rate 9.2% vs local median 4.8% in Kansas City — top-decile yield for the area; either an underpriced asset or a hidden risk that comps aren't pricing in. Stress-test before assuming the spread holds.
- This rent runs 36% of the median local income ($61k/yr) — at the standard rent-burdened threshold; future hikes will face affordability resistance.
Questions for listing agent
- Built in 1952 — when were the roof, HVAC, electrical panel, plumbing, and water heater last replaced?
- Is there a deadline driving the sale (1031 exchange, divorce, estate, relocation)? That informs how much negotiation room exists.
- Schools are F-rated, which usually means shorter tenancies and higher turnover. Who's the typical renter profile here, and what's been the actual vacancy rate?
- Crime grade is F in this area — have there been break-ins, vandalism, or insurance claims at this property in the last 3 years? What carrier currently insures it and at what premium?
- What's the average days-on-market for RENTAL listings here right now (not sales)? A rising rental-DOM trend means longer vacancies and softer asking-rent achievability than the comps imply.
- What's the recent tenant-quality profile in this submarket — average credit score on applications, eviction rate, late-payment / NSF rate, and stable-employment percentage? A property-management company in the area should have these aggregated.
- How much new for-sale + rental construction is in the pipeline within 1–3 miles? Heavy new supply typically softens prices + rents 12–24 months out; constrained supply supports both.
CashFlowRE · CFR-TKQV0MA9VRN8ZF
· Data 1 week ago
cashflowre.app · 2026-05-29