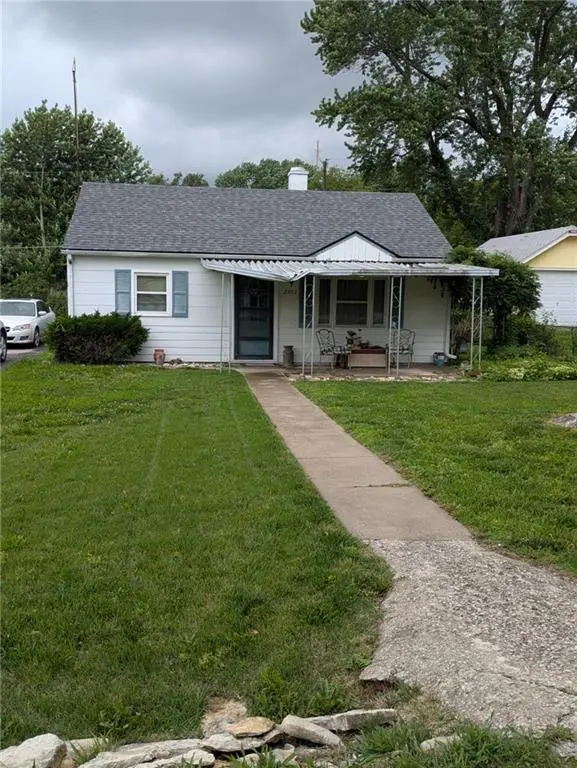
2202 S 37th St · Kansas City, KS
Flood risk 1/10 · Minimal
- FEMA flood zone
- X (unshaded)
- Chance of flooding over 30 yrs
- 0.0%
- Est. flood insurance / yr
- $507 – $1,088
Fire risk 1/10 · Minimal
- Est. fire insurance / yr
- $1,154 – $2,142
Heat risk 4/10 · Minor
- Hot days now (above 107°F)
- 7 days/yr
- Hot days in 30 yrs
- 16 days/yr
Wind risk 2/10 · Minimal
- Chance of severe wind over 30 yrs
- —
Air-quality risk 2/10 · Minimal
- Unhealthy air days now
- 2 days/yr
- Unhealthy air days in 30 yrs
- 2 days/yr
Risk factors via First Street. Map © Google.
Why this score? — see what drove the B- grade
The composite is a weighted blend of 9 inputs, each scored 0–100. Each bar is that input's sub-score; the figure is the points it added to the 100-point composite (weight × sub-score).
- Cash flow +25.8/30.0
- ARV discount +15.0/15.0
- DSCR +8.6/10.0
- 1% rule +7.3/10.0
- Livability +3.6/5.0
- Rent growth +2.5/5.0
- Condition / age +2.5/5.0
- Schools +1.6/10.0
- Appreciation +0.0/10.0
$150,000
🖨 Deal sheet 📄 Offer letter ✓ Due diligence
Listing remarks MLS
Adorable home priced below private '07 appraisal. Move in ready. Newer windows. Has been in one family for years. 10k in upgrades since '07.
Key facts
- 0.23 acre lot
- Built 1952
Property features AI
Finance
- Other: Lot approximately 10,019 square feet; Above-grade finished area reported as 1,174 (public records)
Exterior
- Parking: Off-street parking; Other parking
- Utilities: Public water; Public sewer
- Home design: Single-family residence; Ranch floor plan; Residential property
- Construction: Frame construction; Composition roof; Crawl space basement; Built 51–75 years ago
- Exterior features: Porch; Fixer-up condition; Fencing: other
Interior
- Kitchen: Ceramic tile floors; Pantry; Dishwasher; Disposal; Electric range
- Bedrooms: 3 bedrooms (all on the first floor)
- Flooring: Laminate; Vinyl; Wood
- Bathrooms: 1 full bathroom with ceramic tile and shower-over-tub; 1 half bathroom
- Heating & cooling: Natural gas heating; Electric cooling (has cooling)
- Interior features: Thermal windows; Family room; Living/Dining combo
- Laundry & utility: Laundry located off the kitchen
Neighborhood map
What this means for you Summary
Snapshot
- This is a 3-bed/1.5-bath single-family listed at $150k.
Deal economics
- At list price, monthly cash flow is $364 ($4k/yr) — positive.
- The deal already cash-flows at list — no discount required.
- Meets the 1% rule at list price ($2k rent vs $150k).
- Cap rate 9.2% vs local median 4.8% in Kansas City — top-decile yield for the area; either an underpriced asset or a hidden risk that comps aren't pricing in. Stress-test before assuming the spread holds.
Location & tenants
- Location reads 72/100 on livability (#103 in KS) — a middle-class / working-renter tenant base. Strengths: commute A+, cost of living A+, housing A+; Watch: crime F, employment D-.
- Turner-Kansas City (urban): math 15% / reading 22% proficiency, ranked #161 of 169 in KS (top 95%) — low school quality limits family demand, transient renter base, plan for 1-2y turnover; 64% free/reduced lunch — lower-income household profile, screen leases tightly.
- Zoned schools: Junction Elementary (math 37% / reading 42%, grade F, #321 of 684 statewide, top 52%, 245 students, 69% FRL); Turner High (math 5% / reading 8%, grade F, #318 of 327 statewide, top 97%, 1,171 students, 71% FRL).
- Market conditions: 94 active listings in the ZIP; 4 comparable units currently listed for rent nearby; rentals at typical pace (median 18d on market — plan ~3-4 weeks tenant-placement turnaround); 369 units permitted in Wyandotte County in 2024 (236 in 5+ unit buildings).
- This rent runs 36% of the median local income ($61k/yr) — at the standard rent-burdened threshold; future hikes will face affordability resistance.
Forward outlook
- Local home prices are declining (-3.0%/yr); year-one equity from $1k of loan paydown is wiped out by about $4k of value loss. Plan a longer hold.
- Wyandotte County population projected at +17% by 2050 — long-run rental-demand tailwind backs the buy-and-hold thesis.
Negotiation context
- Only 1 days on market — expect competitive offers; lowballing is unlikely to land.
Risks & watch-outs
- Watch-outs: built in 1952 — expect roof / HVAC / electrical / plumbing capex.
Questions for the listing agent
- Built in 1952 — when were the roof, HVAC, electrical panel, plumbing, and water heater last replaced?
- Is there a deadline driving the sale (1031 exchange, divorce, estate, relocation)? That informs how much negotiation room exists.
- Schools are F-rated, which usually means shorter tenancies and higher turnover. Who's the typical renter profile here, and what's been the actual vacancy rate?
- Crime grade is F in this area — have there been break-ins, vandalism, or insurance claims at this property in the last 3 years? What carrier currently insures it and at what premium?
- What's the average days-on-market for RENTAL listings here right now (not sales)? A rising rental-DOM trend means longer vacancies and softer asking-rent achievability than the comps imply.
- What's the recent tenant-quality profile in this submarket — average credit score on applications, eviction rate, late-payment / NSF rate, and stable-employment percentage? A property-management company in the area should have these aggregated.
- How much new for-sale + rental construction is in the pipeline within 1–3 miles? Heavy new supply typically softens prices + rents 12–24 months out; constrained supply supports both.
Investment metrics
- 1% rule
- 1.23% ✓
- Cap rate
- 9.20%
- Cash-on-cash
- 10.39%
- DSCR
- 1.46
- GRM
- 6.7
CMA / ARV
- ARV (on-the-fly)
- $207,360
- Comps found
- 12
Show comp detail 12 sales within ~0.75 mi
| Address | Dist | Beds/Ba | Sqft | Sold | Price | $/sf | Match |
|---|---|---|---|---|---|---|---|
| 2206 S 34th St | 0.22mi | 3/1.0 | 1,120 (-3%) | 1mo | $199,000 | $178 | 82 |
| 3421 Victoria Dr | 0.20mi | 3/2.0 | 1,152 (0%) | 8mo | $249,950 | $217 | 82 |
| 4118 Gibbs Rd | 0.28mi | 3/1.0 | 1,140 (-1%) | 2mo | $259,990 | $228 | 81 |
| 3615 Dover St | 0.09mi | 3/1.0 | 1,055 (-8%) | 3mo | $189,900 | $180 | 77 |
| 2213 S 38th St | 0.07mi | 3/1.0 | 1,016 (-12%) | 10mo | $175,000 | $172 | 67 |
| 2119 S 38th St | 0.07mi | 3/2.0 | 1,308 (+14%) | 7mo | $259,900 | $199 | 66 |
| 2531 Junction Rd | 0.39mi | 3/2.0 | 1,248 (+8%) | 7mo | $220,000 | $176 | 60 |
| 3800 Gibbs Rd | 0.14mi | 2/1.0 (-1) | 986 (-14%) | 6mo | $160,000 | $162 | 57 |
| 2643 S 30th St | 0.72mi | 3/1.0 | 1,100 (-4%) | 3mo | $200,000 | $182 | 54 |
| 2720 S 42nd St | 0.65mi | 3/2.0 | 1,044 (-9%) | 3mo | $240,000 | $230 | 49 |
| 2620 S 40th Ter | 0.55mi | 2/1.0 (-1) | 1,040 (-10%) | 6mo | $52,000 | $50 | 47 |
| 2446 S 45th St | 0.63mi | 2/1.0 (-1) | 1,268 (+10%) | 6mo | $122,000 | $96 | 41 |
Match score weights: distance 35% · size 25% · config 20% · recency 20%. Top-matched comps best support the ARV.
Projected returns pro-forma
-3.0% appreciation · 3.0% rent growth · sell at horizon
- IRR
- -0.7%
- Equity multiple
- 0.97×
- Total profit
- $-1,082
- Equity at exit
- $22,365
- IRR
- 9.0%
- Equity multiple
- 1.69×
- Total profit
- $29,148
- Equity at exit
- $12,969
Cash invested: $42,000 (down + closing). Projections, not guarantees.
Landlord ↔ Tenant lean methodology
- Overall (STATE)
- 83 Strongly Landlord-Friendly
- State Kansas
- 83 Strongly Landlord-Friendly · R+10
- County
- — inherits STATE
- City
- — inherits STATE
ZIP-level market 66106
- Active inventory
- 94
- Price-to-rent
- 6.7×
Monthly cashflow live
- Estimated rent
- $1,852 medium interval (Pro) →
- Mortgage (P&I)
- −$787
- Tax from tax record
- −$251 /mo · $3,007/yr
- Insurance
- −$62
- HOA
- −$0
- Vacancy / Maint / Mgmt
- −$389
- Net cashflow
- $364
Break-even live
UW: 25.0% down · 7.5% · 30yr · 1.5% tax · 5.0% vac · 8.0% maint · 8.0% mgmt
Financing live
Cash to close
- Down payment
- $37,500
- Closing costs
- $4,500
- Reserves months
- —
- Total cash needed
- —
Loan-product check · same deal, 3 products live
Conventional
25% down · 7.5% · 30yr
- Down + closing
- —
- Monthly P&I
- —
- Monthly cashflow
- —
- DSCR
- —
- Eligible?
- —
Personal DTI + credit; lowest rate.
DSCR
20% down · 8.5% · 30yr
- Down + closing
- —
- Monthly P&I
- —
- Monthly cashflow
- —
- DSCR
- —
- Eligible?
- —
No personal income docs; deal must DSCR.
Hard money
10% down · 12.0% · 12mo
- Down + closing
- —
- Monthly P&I
- —
- Monthly cashflow
- —
- DSCR
- —
- Eligible?
- —
Short-term bridge; refi at stabilization.
Rent comps 4 comps
| Address | Beds | Baths | Sqft | Rent | $/sqft | DOM | Units | Dist |
|---|---|---|---|---|---|---|---|---|
| 2118 S 47th St Kansas City, KS | 3.0 | 1.0 | 1008 | $2,400 | $2.38 | 17d | 1 | 0.80mi |
| 2633 S 49th St Kansas City, KS | 3.0 | 1.0 | 816 | $1,350 | $1.65 | 8d | 1 | 1.17mi |
| 2550 S 51st St Kansas City, KS | 2.0 | 1.0 | 744 | $1,395 | $1.88 | 20d | 1 | 1.34mi |
| 4813 Woodward St Shawnee, KS | 3.0 | 2.0 | 1050 | $1,695 | $1.61 | 3d | 1 | 1.47mi |
Listing history 9 events
-
2026-06-13remarks 699-char remark
-
2026-06-13statusdays on market $150,000 Pending 1 DOM
-
2026-06-09days on market $150,000 Coming Soon 9 DOM
-
2026-06-08days on market $150,000 Coming Soon 8 DOM
-
2026-06-07days on market $150,000 Coming Soon 7 DOM
-
2026-06-03days on market $150,000 Coming Soon 3 DOM
-
2026-06-02days on market $150,000 Coming Soon 2 DOM
-
2026-06-01remarks 330-char remark
-
2026-06-01$150,000 Coming Soon 1 DOM
ⓘ Source: listings_history table (triggers on properties + properties_extension) + one-shot
backfill from property_details.listing_events for pre-trigger history.
Tax reassessment forecast KS · Resets to sale price
- Current annual tax
- $3,007 · $251/mo
- Projected year-2 tax
- $3,007 · $251/mo
- Expected delta
- $0/yr ($0/mo · 0.0%)
ⓘ Screening estimate from a state-policy table — verify with the county assessor before closing.
Climate risk First Street
- Flood 1/10 Low FEMA zone X (unshaded) · 0% chance over 30 yrs
- Wildfire 1/10 Low
- Heat 4/10 Moderate 7 d/yr ≥107°F today · 16 d/yr by 30 yrs out
- Wind 2/10 Low
- Air quality 2/10 Low 2 unhealthy d/yr today · 2 by 30 yrs out
Nearby sold comps map
Loading sold comps map…
Walkable amenities ~0.75 mi
Loading nearby amenities…
Taxation est. · year 1
- Rental income
- $22,227
- − Mortgage interest
- −$8,402
- − Property taxes
- −$3,007
- − Insurance
- −$750
- − Repairs & maintenance
- −$1,778
- − Management
- −$1,778
- − Depreciation
- −$4,364
- Taxable income
- $2,148
- Est. tax owed @ 24.0%
- −$516
- After-tax cash flow
- $3,848/yr
For passive investors: Depreciation is non-cash, so a rental often shows a tax loss while cash-flowing — sheltering income. Rental losses are passive: they offset passive income freely, and up to $25,000/yr can offset ordinary (W-2) income if you actively participate and your MAGI is under $100k (phasing out to $0 by $150k); unused losses carry forward. On sale, claimed depreciation is recaptured at up to 25%, and gains may owe capital-gains tax (a 1031 exchange can defer both). Figures are a year-1 estimate at your 24.0% rate — not tax advice; consult a CPA.
Schools (NCES district)
- District
- Turner-Kansas City
- NCES district ID
- 2012360
- Math proficiency
- 15% ▼ -5.00%
- Reading proficiency
- 22% ▼ -1.00%
- Median HH income
- $45,753
- Composite
- 16.24/100
- National rank
- #9222
- State rank
- #161 of 169 in KS
Livability — Kansas City
- Score
- 72/100
- State rank
- #103
- US rank
- #6054
Category grades
Schools grade is shown separately in the Schools card above.
Census & demographics
- Census place
- Kansas City, KS
- County
- Wyandotte County · 130,206 people
- City population
- 130,206
- Metro
- Kansas City, MO-KS
- Population (ZIP)
- 24,245
- Household income
- $61,331
- Rent vs Own
- Severe rent burden
- 583.0
Population outlook (Wyandotte County) Hauer SSP2
- Today (2025)
- 177,063 people
- By 2030
- 183,212 · +3.5%
- By 2040
- 195,697 · +10.5%
- By 2050
- 207,897 · +17.4%
- By 2075
- 236,169 · +33.4%
- By 2100
- 255,790 · +44.5%
Race, ethnicity, and origin ACS 2023
- Neighborhood character
- Diverse neighborhood (Simpson 0.63)
- Race & ethnicity
- White 47% Hispanic / Latino 38% Two or more races 12% Black 8% Asian 3% Native American 1%
- Hispanic origin (detail)
- Mexican 34%
- Common ancestry
- Lithuanian 2% Italian 1% Slovak 1%
- Foreign-born
- 14% · Canada
- Languages at home
- 68% English-only · Spanish 29% Other Asian/Pacific 2%
Political lean MEDSL · Wyandotte
- 2024 margin
- Strong D (+23.9) · D 61.1% · R 37.3% · Other 1.6%
- 2008→2024 swing
- -17.0pp toward R · 2008: 40.9pp · 2024: 23.9pp
- All cycles
- 2024: D+23.9 2020: D+30.9 2016: D+29.1 2012: D+36.4 2008: D+40.9
Not yet ingested
- Civics
- —
Market trends
- HPI YoY
- ▼ -253.32%
- Current HPI
- 239.6957
- Rent YoY
- —
- Metro
- Kansas City, MO-KS
- State GDP YoY
- —
- F500 in state
- 0
Price history
+77.5% since first listed5 events — show timeline
- 2026-06-01 Coming Soon $150,000 Heartland MLS as Distributed by MLS Grid
- 2015-03-24 Sold (Public Records) — Public Records
- 2015-03-23 Sold (MLS) — Heartland MLS as Distributed by MLS Grid
- 2014-12-19 Listed $84,500 Heartland MLS as Distributed by MLS Grid
- 2007-02-05 Sold (Public Records) — Public Records
Property tax history
+6.8%/yrLatest (2025): $3,007 · +7.2% YoY. Source: county tax records.
Cash-flow waterfall
monthlySold comps — $/sqft
last 12 mo · ≤1 miLoading sold comps…