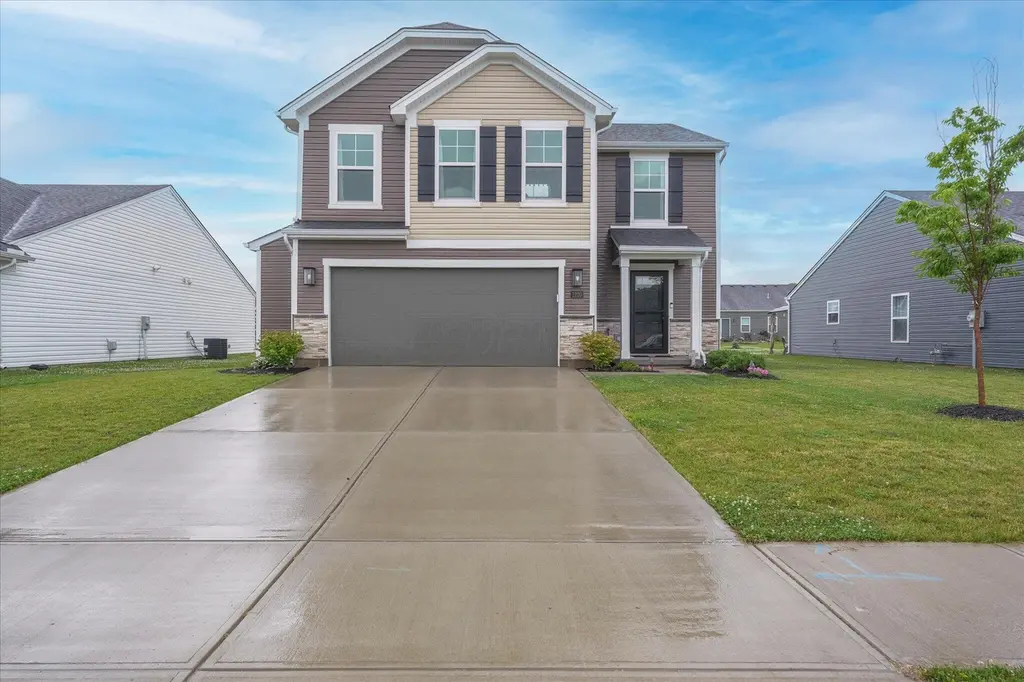
1220 Timber Glen Dr
Wilmington, OH 45177
$369,000D+
4 bd · 2.5 ba ·
1,965 sqft ·
Built 2023
· SingleFamily
· Active
· 5 DOM
Cashflow @ list (25.0% down · 7.5%)
Estimated rent
$4,112/mo
Mortgage (P&I)
−$1,935
Tax + insurance
−$615
HOA
−$29
Vac / Maint / Mgmt
−$864
Net cashflow
$669/mo
Annual
$8,034/yr
Cap rate
8.47%
Cash-on-cash
7.78%
DSCR
1.35
1% rule
1.11%
Cash to close
$103,320
Investor read
- This is a 4-bed/2.5-bath single-family listed at $369k.
- At list price, monthly cash flow is $669 ($8k/yr) — positive.
- The deal already cash-flows at list — no discount required.
- Meets the 1% rule at list price ($4k rent vs $369k).
- Only 5 days on market — expect competitive offers; lowballing is unlikely to land.
- Local home prices are declining (-3.0%/yr); year-one equity from $3k of loan paydown is wiped out by about $11k of value loss. Plan a longer hold.
- Location reads 77/100 on livability (#202 in OH, #3,127 nationally) — a middle-class / working-renter tenant base. Strengths: cost of living A+, housing A+, health & safety A+; Watch: schools C-, amenities D, commute F.
- Wilmington City (town): math 42% / reading 51% proficiency, ranked #492 of 656 in OH (top 75%) — families likely to look elsewhere, expect single-tenant / working-renter base with shorter leases.
- Market conditions: 107 active listings in the ZIP; 3 comparable units currently listed for rent nearby; rentals leasing fast (median 3d on market — plan ~1-2 weeks tenant-placement turnaround); 119 units permitted in Clinton County in 2024 (0 in 5+ unit buildings).
- Clinton County population projected at -12% by 2050 — secular population decline; favor cash flow + early exit over multi-decade hold.
- 3 sale attempts since 3y ago with the ask held roughly flat each time — persistent listings suggest the price (not the market) is what's stuck; bring a comps-based counter.
- Current owner paid $289k; 28% above their basis — modest negotiation headroom, anchor on the comps not their cost.
- Cap rate 8.5% vs local median 6.2% in Wilmington — top-decile yield for the area; either an underpriced asset or a hidden risk that comps aren't pricing in. Stress-test before assuming the spread holds.
- At $4,112/mo this rent would consume 70% of the median local household income ($70k/yr) — very limited rent-growth headroom before tenants either downsize or default.
Questions for listing agent
- What does the HOA fee cover, when was the last increase, and are there any pending special assessments or reserve-fund shortfalls?
- Is there a deadline driving the sale (1031 exchange, divorce, estate, relocation)? That informs how much negotiation room exists.
- The area grade is low — what's the realistic commute time and amenity access for the typical tenant pool here? Any planned neighborhood developments (good or bad) we should know about?
- What's the average days-on-market for RENTAL listings here right now (not sales)? A rising rental-DOM trend means longer vacancies and softer asking-rent achievability than the comps imply.
- What's the recent tenant-quality profile in this submarket — average credit score on applications, eviction rate, late-payment / NSF rate, and stable-employment percentage? A property-management company in the area should have these aggregated.
- How much new for-sale + rental construction is in the pipeline within 1–3 miles? Heavy new supply typically softens prices + rents 12–24 months out; constrained supply supports both.
CashFlowRE · CFR-TM0SNDCZG7DSCE
· Data 2 days ago
cashflowre.app · 2026-05-29