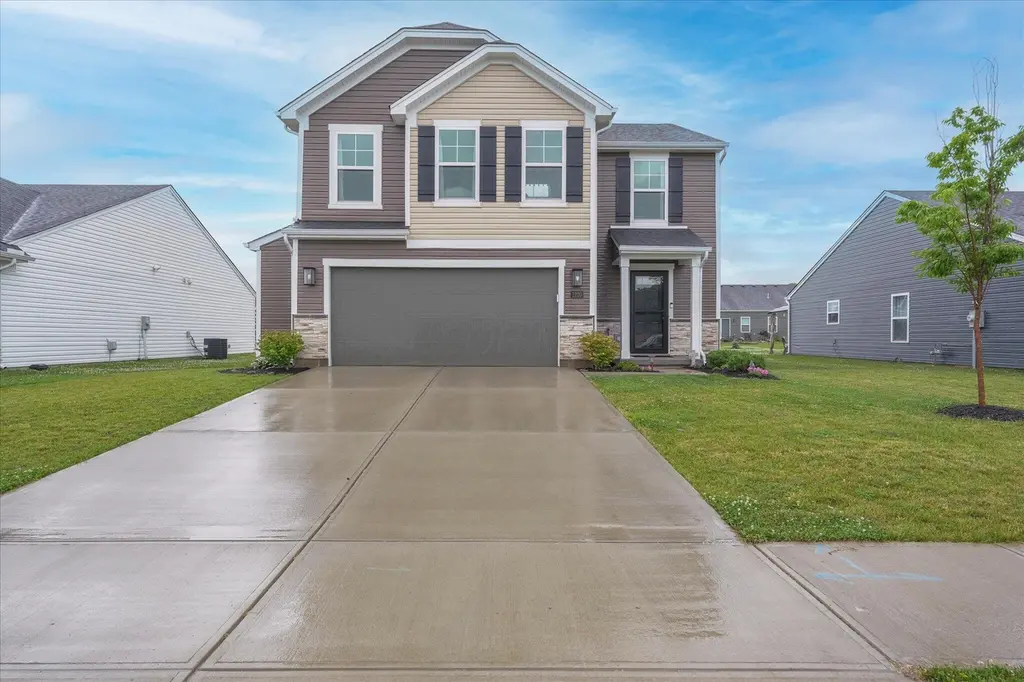
1220 Timber Glen Dr · Wilmington, OH
Flood risk 1/10 · Minimal
- FEMA flood zone
- X (unshaded)
- Chance of flooding over 30 yrs
- 0.0%
- Est. flood insurance / yr
- $507 – $1,088
Fire risk 1/10 · Minimal
- Est. fire insurance / yr
- $713 – $1,323
Heat risk 3/10 · Minor
- Hot days now (above 100°F)
- 7 days/yr
- Hot days in 30 yrs
- 19 days/yr
Wind risk 2/10 · Minimal
- Chance of severe wind over 30 yrs
- 1.0%
Air-quality risk 2/10 · Minimal
- Unhealthy air days now
- 1 days/yr
- Unhealthy air days in 30 yrs
- 2 days/yr
Risk factors via First Street. Map © Google.
Why this score? — see what drove the D+ grade
The composite is a weighted blend of 9 inputs, each scored 0–100. Each bar is that input's sub-score; the figure is the points it added to the 100-point composite (weight × sub-score).
- Cash flow +23.2/30.0
- DSCR +7.5/10.0
- 1% rule +6.1/10.0
- Schools +3.9/10.0
- Livability +3.9/5.0
- Rent growth +2.5/5.0
- Condition / age +2.5/5.0
- ARV discount +0.0/15.0
- Appreciation +0.0/10.0
$369,000
🖨 Deal sheet 📄 Offer letter ✓ Due diligence
Listing remarks MLS
The Tyndale Design by Cristo Homes! Beautiful 4 bed, 2.5 bath with ~1872 sqft of living space! Open kitchen design with island + pantry adjoins the spacious Great Room, as well as the dining area with access to back yard. The private Grand Bedroom features adjoining bathroom and not one, but two walk-in closets! Ultra-convenient 2nd floor laundry! Oversized two car garage w storage space!
Key facts
- Quiet street
- Newer built home
- Low utility costs
Tags
Property features AI
Finance
- Other: Property located in Wilmington CSD; listing broker Key Realty
- HOA & community: Homeowners association with annual fee of $350; Subdivision amenities include sidewalks
Exterior
- Parking: Attached garage with 2 garage spaces; Garage door opener
- Utilities: Public water; Public sewer
- Home design: Single-family residence; Two stories; Built in 2023; No common walls
- Construction: Block foundation; Built in 2023
- Exterior features: Patio; Block foundation; Lot in Timber Glen subdivision on a 0.2-acre lot
Interior
- Flooring: Laminate flooring; Carpet
- Bathrooms: Two full bathrooms and one half bathroom (2.5 total)
- Heating & cooling: Central air conditioning; Forced air heating
- Interior features: Insulated windows throughout; Living area approximately 1965
- Laundry & utility: Home warranty included
Neighborhood map
What this means for you Summary
Snapshot
- This is a 4-bed/2.5-bath single-family listed at $369k.
Deal economics
- At list price, monthly cash flow is $669 ($8k/yr) — positive.
- The deal already cash-flows at list — no discount required.
- Meets the 1% rule at list price ($4k rent vs $369k).
- Cap rate 8.5% vs local median 6.2% in Wilmington — top-decile yield for the area; either an underpriced asset or a hidden risk that comps aren't pricing in. Stress-test before assuming the spread holds.
Location & tenants
- Location reads 77/100 on livability (#202 in OH, #3,127 nationally) — a middle-class / working-renter tenant base. Strengths: cost of living A+, housing A+, health & safety A+; Watch: schools C-, amenities D, commute F.
- Wilmington City (town): math 42% / reading 51% proficiency, ranked #492 of 656 in OH (top 75%) — families likely to look elsewhere, expect single-tenant / working-renter base with shorter leases.
- Market conditions: 107 active listings in the ZIP; 3 comparable units currently listed for rent nearby; rentals leasing fast (median 3d on market — plan ~1-2 weeks tenant-placement turnaround); 119 units permitted in Clinton County in 2024 (0 in 5+ unit buildings).
- At $4,112/mo this rent would consume 70% of the median local household income ($70k/yr) — very limited rent-growth headroom before tenants either downsize or default.
Forward outlook
- Local home prices are declining (-3.0%/yr); year-one equity from $3k of loan paydown is wiped out by about $11k of value loss. Plan a longer hold.
- Clinton County population projected at -12% by 2050 — secular population decline; favor cash flow + early exit over multi-decade hold.
Negotiation context
- Only 5 days on market — expect competitive offers; lowballing is unlikely to land.
- 3 sale attempts since 3y ago with the ask held roughly flat each time — persistent listings suggest the price (not the market) is what's stuck; bring a comps-based counter.
- Current owner paid $289k; 28% above their basis — modest negotiation headroom, anchor on the comps not their cost.
Questions for the listing agent
- What does the HOA fee cover, when was the last increase, and are there any pending special assessments or reserve-fund shortfalls?
- Is there a deadline driving the sale (1031 exchange, divorce, estate, relocation)? That informs how much negotiation room exists.
- The area grade is low — what's the realistic commute time and amenity access for the typical tenant pool here? Any planned neighborhood developments (good or bad) we should know about?
- What's the average days-on-market for RENTAL listings here right now (not sales)? A rising rental-DOM trend means longer vacancies and softer asking-rent achievability than the comps imply.
- What's the recent tenant-quality profile in this submarket — average credit score on applications, eviction rate, late-payment / NSF rate, and stable-employment percentage? A property-management company in the area should have these aggregated.
- How much new for-sale + rental construction is in the pipeline within 1–3 miles? Heavy new supply typically softens prices + rents 12–24 months out; constrained supply supports both.
Investment metrics
- 1% rule
- 1.11% ✓
- Cap rate
- 8.47%
- Cash-on-cash
- 7.78%
- DSCR
- 1.35
- GRM
- 7.5
CMA / ARV
- ARV (on-the-fly)
- $312,435
- Comps found
- 11
Show comp detail 11 sales within ~0.75 mi
| Address | Dist | Beds/Ba | Sqft | Sold | Price | $/sf | Match |
|---|---|---|---|---|---|---|---|
| 490 Red Maple Ln | 0.18mi | 4/2.5 | 2,156 (+10%) | 2mo | $339,900 | $158 | 74 |
| 668 Catalpa Dr | 0.09mi | 4/2.5 | 2,250 (+14%) | 2mo | $358,000 | $159 | 69 |
| 432 Red Maple Ln | 0.18mi | 4/3.0 | 1,802 (-8%) | 12mo | $449,940 | $250 | 66 |
| 1300 Blue Spruce Ln | 0.13mi | 4/3.0 | 1,797 (-8%) | 14mo | $426,244 | $237 | 66 |
| 514 Red Maple Ln | 0.18mi | 4/2.5 | 2,254 (+15%) | 3mo | $358,900 | $159 | 65 |
| 1282 Ridge Rd | 0.51mi | 4/2.5 | 1,896 (-4%) | 18mo | $250,000 | $132 | 56 |
| 1087 Warren Dr | 0.58mi | 3/2.5 (-1) | 2,100 (+7%) | 2mo | $285,000 | $136 | 55 |
| 21 Garden Cir | 0.54mi | 3/2.0 (-1) | 1,853 (-6%) | 11mo | $314,900 | $170 | 49 |
| 1985 St Rt 730 | 0.74mi | 3/3.0 (-1) | 1,860 (-5%) | 4mo | $305,000 | $164 | 46 |
| 1086 Warren Dr | 0.55mi | 4/2.5 | 2,224 (+13%) | 19mo | $329,000 | $148 | 36 |
| 641 Norman St | 0.68mi | 3/2.0 (-1) | 1,800 (-8%) | 21mo | $204,500 | $114 | 30 |
Match score weights: distance 35% · size 25% · config 20% · recency 20%. Top-matched comps best support the ARV.
Projected returns pro-forma
-3.0% appreciation · 3.0% rent growth · sell at horizon
- IRR
- -4.4%
- Equity multiple
- 0.83×
- Total profit
- $-17,073
- Equity at exit
- $55,019
- IRR
- 5.3%
- Equity multiple
- 1.39×
- Total profit
- $40,364
- Equity at exit
- $31,904
Cash invested: $103,320 (down + closing). Projections, not guarantees.
Landlord ↔ Tenant lean methodology
- Overall (STATE)
- 73 Landlord-Friendly
- State Ohio
- 73 Landlord-Friendly · R+6
- County
- — inherits STATE
- City
- — inherits STATE
ZIP-level market 45177
- Active inventory
- 107
- Price-to-rent
- 7.5×
Monthly cashflow live
- Estimated rent
- $4,112 medium interval (Pro) →
- Mortgage (P&I)
- −$1,935
- Tax est. 1.5%
- −$461 /mo · $5,535/yr
- Insurance
- −$154
- HOA
- −$29
- Vacancy / Maint / Mgmt
- −$864
- Net cashflow
- $669
Break-even live
UW: 25.0% down · 7.5% · 30yr · 1.5% tax · 5.0% vac · 8.0% maint · 8.0% mgmt
Financing live
Cash to close
- Down payment
- $92,250
- Closing costs
- $11,070
- Reserves months
- —
- Total cash needed
- —
Loan-product check · same deal, 3 products live
Conventional
25% down · 7.5% · 30yr
- Down + closing
- —
- Monthly P&I
- —
- Monthly cashflow
- —
- DSCR
- —
- Eligible?
- —
Personal DTI + credit; lowest rate.
DSCR
20% down · 8.5% · 30yr
- Down + closing
- —
- Monthly P&I
- —
- Monthly cashflow
- —
- DSCR
- —
- Eligible?
- —
No personal income docs; deal must DSCR.
Hard money
10% down · 12.0% · 12mo
- Down + closing
- —
- Monthly P&I
- —
- Monthly cashflow
- —
- DSCR
- —
- Eligible?
- —
Short-term bridge; refi at stabilization.
Rent comps 3 comps
| Address | Beds | Baths | Sqft | Rent | $/sqft | DOM | Units | Dist |
|---|---|---|---|---|---|---|---|---|
| 109 Southwind Blvd Wilmington, OH | 3.0 | 2.0 | 1344 | $4,995 | $3.72 | 2d | 1 | 0.78mi |
| 121 Southwind Blvd Wilmington, OH | 3.0 | 2.0 | 1344 | $4,995 | $3.72 | 2d | 1 | 0.79mi |
| 229 Taylor Dr Wilmington, OH | 3.0 | 2.0 | 1242 | $2,000 | $1.61 | 11d | 1 | 0.87mi |
HOA detail
- Monthly dues
- $29 · $348/yr
Listing history 6 events
-
2026-06-18days on market $369,000 Active 5 DOM
-
2026-06-17days on market $369,000 Active 4 DOM
-
2026-06-16days on market $369,000 Active 3 DOM
-
2026-06-15days on market $369,000 Active 2 DOM
-
2026-06-14remarks 699-char remark
-
2026-06-14$369,000 Active 1 DOM
ⓘ Source: listings_history table (triggers on properties + properties_extension) + one-shot
backfill from property_details.listing_events for pre-trigger history.
Climate risk First Street
- Flood 1/10 Low FEMA zone X (unshaded) · 0% chance over 30 yrs
- Wildfire 1/10 Low
- Heat 3/10 Moderate 7 d/yr ≥100°F today · 19 d/yr by 30 yrs out
- Wind 2/10 Low 100% chance of damaging wind over 30 yrs
- Air quality 2/10 Low 1 unhealthy d/yr today · 2 by 30 yrs out
Nearby sold comps map
Loading sold comps map…
Walkable amenities ~0.75 mi
Loading nearby amenities…
Taxation est. · year 1
- Rental income
- $49,345
- − Mortgage interest
- −$20,670
- − Property taxes
- −$5,535
- − Insurance
- −$1,845
- − Repairs & maintenance
- −$3,948
- − Management
- −$3,948
- − HOA
- −$348
- − Depreciation
- −$10,735
- Taxable income
- $2,318
- Est. tax owed @ 24.0%
- −$556
- After-tax cash flow
- $7,478/yr
For passive investors: Depreciation is non-cash, so a rental often shows a tax loss while cash-flowing — sheltering income. Rental losses are passive: they offset passive income freely, and up to $25,000/yr can offset ordinary (W-2) income if you actively participate and your MAGI is under $100k (phasing out to $0 by $150k); unused losses carry forward. On sale, claimed depreciation is recaptured at up to 25%, and gains may owe capital-gains tax (a 1031 exchange can defer both). Figures are a year-1 estimate at your 24.0% rate — not tax advice; consult a CPA.
Schools (NCES district)
- District
- Wilmington City
- NCES district ID
- 3904511
- Math proficiency
- 42% ▼ -16.00%
- Reading proficiency
- 51% ▼ -6.00%
- Median HH income
- $43,201
- Composite
- 39.2/100
- National rank
- #4020
- State rank
- #492 of 656 in OH
Livability — Wilmington
- Score
- 77/100
- State rank
- #202
- US rank
- #3127
Category grades
Schools grade is shown separately in the Schools card above.
Census & demographics
- Census place
- Wilmington, OH
- County
- Clinton · 46,911 people
- Population (ZIP)
- 22,442
- Household income
- $70,483
- Rent vs Own
- Severe rent burden
- 9.5
Population outlook (Clinton County) Hauer SSP2
- Today (2025)
- 41,352 people
- By 2030
- 40,831 · -1.3%
- By 2040
- 39,049 · -5.6%
- By 2050
- 36,408 · -12.0%
- By 2075
- 29,652 · -28.3%
- By 2100
- 20,736 · -49.9%
Race, ethnicity, and origin ACS 2023
- Neighborhood character
- Predominantly White (91%)
- Race & ethnicity
- White 91% Two or more races 3% Black 3% Hispanic / Latino 2% Asian 1%
- Common ancestry
- Lithuanian 2% Slovak 2% Romanian 2%
- Foreign-born
- 3% · Canada, Jamaica
- Languages at home
- 97% English-only · Spanish 1% Other Asian/Pacific 1%
Political lean MEDSL · Clinton
- 2024 margin
- Solid R (+54.6) · D 22.3% · R 76.9%
- 2008→2024 swing
- -24.3pp toward R · 2008: -30.3pp · 2024: -54.6pp
- All cycles
- 2024: R+54.6 2020: R+52.6 2016: R+52.6 2012: R+35.2 2008: R+30.3
Not yet ingested
- Civics
- —
Market trends
- HPI YoY
- ▼ -150.35%
- Current HPI
- 238.9182
- Rent YoY
- —
- Metro
- —
- State GDP YoY
- ▲ 1.98%
- F500 in state
- 48
Industry mix (Fortune 500 HQ in OH)
| Industry | F500 HQs | Revenue |
|---|---|---|
| Insurance | 3 | $145B |
|
||
| Industrial Machinery | 3 | $49B |
|
||
| Financial Services | 3 | $24B |
|
||
| Consumer Goods | 2 | $93B |
|
||
| Aerospace / Defense | 2 | $47B |
|
||
| Utilities | 2 | $33B |
|
||
Price history
+48.1% since first listed11 events — show timeline
- 2026-06-13 Listed $369,000 CBRMLS
- 2023-12-13 Sold (MLS) $289,135 Cincy MLS
- 2023-12-13 Sold (MLS) $289,135 Dayton MLS
- 2023-12-13 Sold (MLS) $289,135 Dayton MLS
- 2023-09-27 Pending — Dayton MLS
- 2023-09-27 Pending — Cincy MLS
- 2023-07-31 Price Changed $294,135 Dayton MLS
- 2023-07-30 Price Changed $294,135 Cincy MLS
- 2023-07-30 Listed $249,135 Cincy MLS
- 2023-07-30 Listed $249,135 Dayton MLS
- 2023-07-24 Sold (Public Records) $714 Public Records
Property tax history
-7.7%/yrLatest (2025): $556 · -4.7% YoY. Source: county tax records.
Cash-flow waterfall
monthlySold comps — $/sqft
last 12 mo · ≤1 miLoading sold comps…