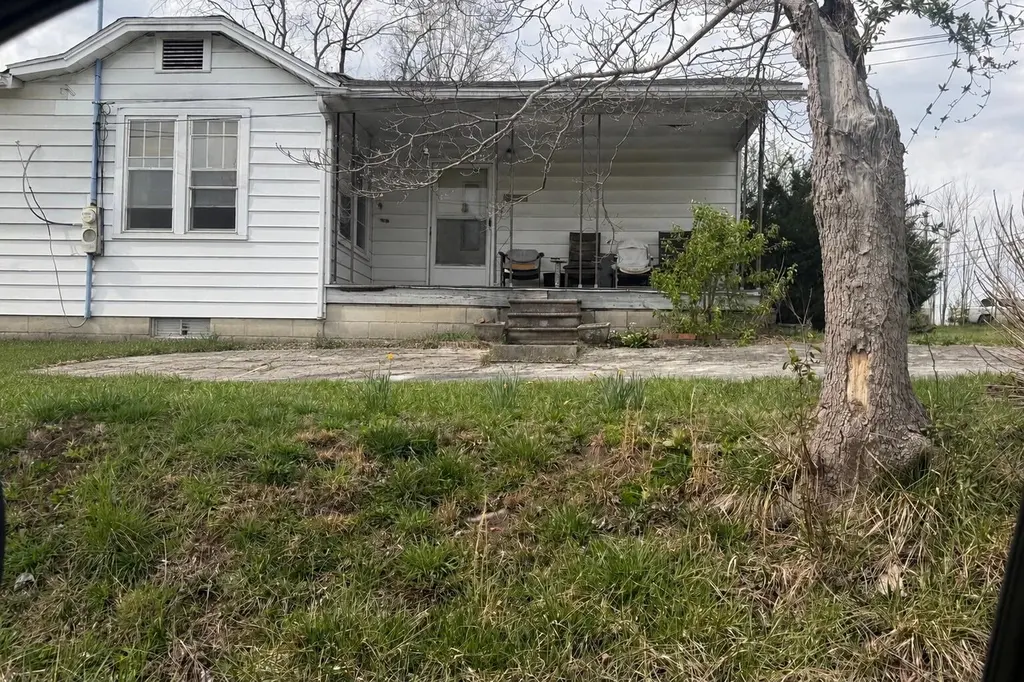
297 N Stewart Rd
London, KY 40701
$99,000B
2 bd · 2.0 ba ·
1,649 sqft ·
Built 1955
· SingleFamily
· Pending
· 12 DOM
Cashflow @ list (25.0% down · 7.5%)
Estimated rent
$1,000/mo
Mortgage (P&I)
−$519
Tax + insurance
−$66
HOA
−$0
Vac / Maint / Mgmt
−$210
Net cashflow
$205/mo
Annual
$2,463/yr
Cap rate
8.78%
Cash-on-cash
8.89%
DSCR
1.40
1% rule
1.01%
Cash to close
$27,720
Investor read
- This is a 2-bed/2.0-bath single-family listed at $99k.
- At list price, monthly cash flow is $205 ($2k/yr) — positive.
- The deal already cash-flows at list — no discount required.
- Meets the 1% rule at list price ($1k rent vs $99k).
- Only 12 days on market — expect competitive offers; lowballing is unlikely to land.
- In year one you build about $2k of equity ($684 loan paydown + $2k appreciation (1.8% local appreciation)).
- Location reads 68/100 on livability (#202 in KY) — a middle-class / working-renter tenant base. Strengths: cost of living A+, housing A+, health & safety B+; Watch: employment D+, amenities F, commute F.
- Laurel County (town): math 51% / reading 56% proficiency, ranked #8 of 165 in KY (top 5%) — acceptable for families but not a draw, mixed tenant base, ~2y average lease.
- Zoned schools: Hunter Hills Elementary School (math 57% / reading 67%, grade B, #24 of 676 statewide, top 4%, 568 students, 81% FRL); South Laurel Middle School (math 36% / reading 50%, grade D-, #43 of 217 statewide, top 21%, 979 students, 70% FRL); South Laurel High School (math 37% / reading 42%, grade F, #40 of 254 statewide, top 19%, 1,108 students, 66% FRL).
- Watch-outs: built in 1955 — expect roof / HVAC / electrical / plumbing capex.
- Market conditions: 332 active listings in the ZIP; 1 comparable units currently listed for rent nearby; 16 units permitted in Laurel County in 2024 (0 in 5+ unit buildings).
- 3 sale attempts; this cycle's ask has dropped $40k (29%) from the opening price — seller is motivated, your offer sets the floor, not the list.
- Current owner paid $76k; 30% above their basis — modest negotiation headroom, anchor on the comps not their cost.
- At projected returns (1.8% appreciation + 3.0% rent growth), your $28k cash investment doubles in ~5 years — after that, you're playing with house money.
- Cap rate 8.8% vs local median 2.2% in London — top-decile yield for the area; either an underpriced asset or a hidden risk that comps aren't pricing in. Stress-test before assuming the spread holds.
Questions for listing agent
- Built in 1955 — when were the roof, HVAC, electrical panel, plumbing, and water heater last replaced?
- Is there a deadline driving the sale (1031 exchange, divorce, estate, relocation)? That informs how much negotiation room exists.
- Schools are D-rated, which usually means shorter tenancies and higher turnover. Who's the typical renter profile here, and what's been the actual vacancy rate?
- What's the average days-on-market for RENTAL listings here right now (not sales)? A rising rental-DOM trend means longer vacancies and softer asking-rent achievability than the comps imply.
- What's the recent tenant-quality profile in this submarket — average credit score on applications, eviction rate, late-payment / NSF rate, and stable-employment percentage? A property-management company in the area should have these aggregated.
- How much new for-sale + rental construction is in the pipeline within 1–3 miles? Heavy new supply typically softens prices + rents 12–24 months out; constrained supply supports both.
CashFlowRE · CFR-TN6DMQ15WFVQJF
· Data 1 week ago
cashflowre.app · 2026-05-29