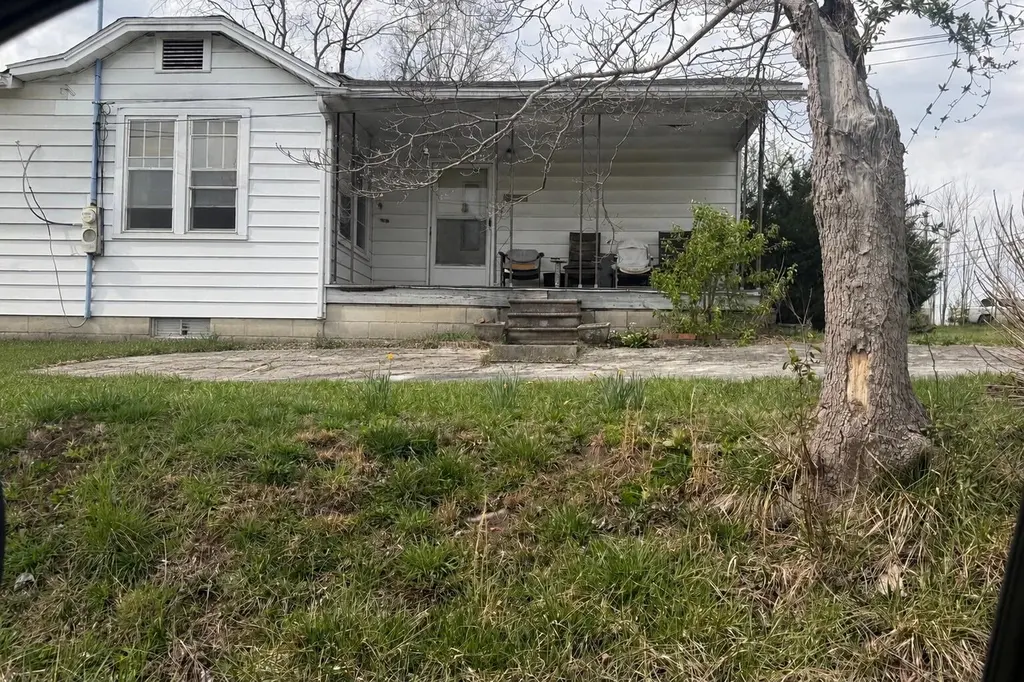
297 N Stewart Rd · London, KY
Flood risk 1/10 · Minimal
- FEMA flood zone
- X (unshaded)
- Chance of flooding over 30 yrs
- 0.0%
- Est. flood insurance / yr
- $473 – $860
Fire risk 3/10 · Minor
- Est. fire insurance / yr
- $839 – $1,559
Heat risk 4/10 · Minor
- Hot days now (above 100°F)
- 7 days/yr
- Hot days in 30 yrs
- 19 days/yr
Wind risk 2/10 · Minimal
- Chance of severe wind over 30 yrs
- 3.0%
Air-quality risk 2/10 · Minimal
- Unhealthy air days now
- 0 days/yr
- Unhealthy air days in 30 yrs
- 1 days/yr
Risk factors via First Street. Map © Google.
Why this score? — see what drove the B grade
The composite is a weighted blend of 9 inputs, each scored 0–100. Each bar is that input's sub-score; the figure is the points it added to the 100-point composite (weight × sub-score).
- Cash flow +24.6/30.0
- ARV discount +15.0/15.0
- DSCR +8.0/10.0
- Appreciation +5.9/10.0
- 1% rule +5.1/10.0
- Schools +4.4/10.0
- Livability +3.4/5.0
- Rent growth +2.5/5.0
- Condition / age +2.5/5.0
$99,000
🖨 Deal sheet 📄 Offer letter ✓ Due diligence
Listing remarks
INVESTORS, here is a perfect opportunity to add this one to your portfolio. This 3 bedroom, 2.5-bath home sits on a spacious 1-acre lot and features a newer roof. The property includes an unfinished basement, offering potential for additional living space or storage. In need of repairs, this home is being sold AS-IS and is ideal for investors or buyers looking to customize a property to their liking. Inspections are welcome. Convenient to I-75, Walmart and shopping. Furniture stays with the house. Do not miss out on this opportunity!!!!!!!!!!
Key facts
- Newer roof
- Unfinished basement
- Convenient to i-75
Tags
Property features AI
Finance
- Other: Property sits on a 1.00 acre lot (public records)
Exterior
- Parking: Driveway
- Utilities: Public water; Septic tank; Electricity connected; Natural gas connected; Water connected
- Home design: House; Two levels
- Construction: Vinyl siding; Block foundation; Shingle roof; Built area approximately 1,499
- Exterior features: Shed(s)
Interior
- Kitchen: Refrigerator; Range
- Bedrooms: 3 total rooms
- Flooring: Carpet; Wood
- Bathrooms: 2 full bathrooms; 1 half bathroom
- Heating & cooling: Natural gas heating; Central air conditioning
- Interior features: Primary bedroom on the first floor; Partially finished basement; No fireplace
- Laundry & utility: Washer hookup; Electric dryer hookup
Neighborhood map
What this means for you Summary
Snapshot
- This is a 2-bed/2.0-bath single-family listed at $99k.
Deal economics
- At list price, monthly cash flow is $205 ($2k/yr) — positive.
- The deal already cash-flows at list — no discount required.
- Meets the 1% rule at list price ($1k rent vs $99k).
- Cap rate 8.8% vs local median 2.2% in London — top-decile yield for the area; either an underpriced asset or a hidden risk that comps aren't pricing in. Stress-test before assuming the spread holds.
Location & tenants
- Location reads 68/100 on livability (#202 in KY) — a middle-class / working-renter tenant base. Strengths: cost of living A+, housing A+, health & safety B+; Watch: employment D+, amenities F, commute F.
- Laurel County (town): math 51% / reading 56% proficiency, ranked #8 of 165 in KY (top 5%) — acceptable for families but not a draw, mixed tenant base, ~2y average lease.
- Zoned schools: Hunter Hills Elementary School (math 57% / reading 67%, grade B, #24 of 676 statewide, top 4%, 568 students, 81% FRL); South Laurel Middle School (math 36% / reading 50%, grade D-, #43 of 217 statewide, top 21%, 979 students, 70% FRL); South Laurel High School (math 37% / reading 42%, grade F, #40 of 254 statewide, top 19%, 1,108 students, 66% FRL).
- Market conditions: 332 active listings in the ZIP; 1 comparable units currently listed for rent nearby; 16 units permitted in Laurel County in 2024 (0 in 5+ unit buildings).
Forward outlook
- In year one you build about $2k of equity ($684 loan paydown + $2k appreciation (1.8% local appreciation)).
- At projected returns (1.8% appreciation + 3.0% rent growth), your $28k cash investment doubles in ~5 years — after that, you're playing with house money.
Negotiation context
- Only 12 days on market — expect competitive offers; lowballing is unlikely to land.
- 3 sale attempts; this cycle's ask has dropped $40k (29%) from the opening price — seller is motivated, your offer sets the floor, not the list.
- Current owner paid $76k; 30% above their basis — modest negotiation headroom, anchor on the comps not their cost.
Risks & watch-outs
- Watch-outs: built in 1955 — expect roof / HVAC / electrical / plumbing capex.
Questions for the listing agent
- Built in 1955 — when were the roof, HVAC, electrical panel, plumbing, and water heater last replaced?
- Is there a deadline driving the sale (1031 exchange, divorce, estate, relocation)? That informs how much negotiation room exists.
- Schools are D-rated, which usually means shorter tenancies and higher turnover. Who's the typical renter profile here, and what's been the actual vacancy rate?
- What's the average days-on-market for RENTAL listings here right now (not sales)? A rising rental-DOM trend means longer vacancies and softer asking-rent achievability than the comps imply.
- What's the recent tenant-quality profile in this submarket — average credit score on applications, eviction rate, late-payment / NSF rate, and stable-employment percentage? A property-management company in the area should have these aggregated.
- How much new for-sale + rental construction is in the pipeline within 1–3 miles? Heavy new supply typically softens prices + rents 12–24 months out; constrained supply supports both.
Investment metrics
- 1% rule
- 1.01% ✓
- Cap rate
- 8.78%
- Cash-on-cash
- 8.89%
- DSCR
- 1.40
- GRM
- 8.2
CMA / ARV
- ARV (median comp)
- $156,536
- List price
- $99,000
- Delta
- -23.34%
- Verdict
- UNDERPRICED
- Comps
- 11 within 1.0 mi
Show comp detail 5 sales within ~0.75 mi
| Address | Dist | Beds/Ba | Sqft | Sold | Price | $/sf | Match |
|---|---|---|---|---|---|---|---|
| 297 N Stewart Rd | 0.00mi | 3/2.5 (+1) | 1,499 (-9%) | 0mo | $76,000 | $51 | 78 |
| 3217 North State Hwy 1223 | 0.21mi | 3/2.0 (+1) | 1,471 (-11%) | 15mo | $224,000 | $152 | 55 |
| 33 Chase Ln | 0.66mi | 3/2.0 (+1) | 1,560 (-5%) | 9mo | $218,000 | $140 | 48 |
| 47 Valley Brook Pl | 0.44mi | 3/2.0 (+1) | 1,456 (-12%) | 20mo | $169,900 | $117 | 38 |
| 44 Valley Brook Pl | 0.44mi | 3/2.0 (+1) | 1,456 (-12%) | 22mo | $185,000 | $127 | 37 |
Match score weights: distance 35% · size 25% · config 20% · recency 20%. Top-matched comps best support the ARV.
Projected returns pro-forma
1.82% appreciation · 3.0% rent growth · sell at horizon
- IRR
- 12.8%
- Equity multiple
- 1.68×
- Total profit
- $18,935
- Equity at exit
- $38,111
- IRR
- 15.6%
- Equity multiple
- 3.05×
- Total profit
- $56,896
- Equity at exit
- $54,170
Cash invested: $27,720 (down + closing). Projections, not guarantees.
Landlord ↔ Tenant lean methodology
- Overall (STATE)
- 83 Strongly Landlord-Friendly
- State Kentucky
- 83 Strongly Landlord-Friendly · R+16
- County
- — inherits STATE
- City
- — inherits STATE
ZIP-level market 40701
- Home prices YoY
- 0.6%
- Active inventory
- 332
- Price-to-rent
- 8.2×
Monthly cashflow live
- Estimated rent
- $1,000 medium interval (Pro) →
- Mortgage (P&I)
- −$519
- Tax from tax record
- −$24 /mo · $292/yr
- Insurance
- −$41
- HOA
- −$0
- Vacancy / Maint / Mgmt
- −$210
- Net cashflow
- $205
Break-even live
UW: 25.0% down · 7.5% · 30yr · 1.5% tax · 5.0% vac · 8.0% maint · 8.0% mgmt
Financing live
Cash to close
- Down payment
- $24,750
- Closing costs
- $2,970
- Reserves months
- —
- Total cash needed
- —
Loan-product check · same deal, 3 products live
Conventional
25% down · 7.5% · 30yr
- Down + closing
- —
- Monthly P&I
- —
- Monthly cashflow
- —
- DSCR
- —
- Eligible?
- —
Personal DTI + credit; lowest rate.
DSCR
20% down · 8.5% · 30yr
- Down + closing
- —
- Monthly P&I
- —
- Monthly cashflow
- —
- DSCR
- —
- Eligible?
- —
No personal income docs; deal must DSCR.
Hard money
10% down · 12.0% · 12mo
- Down + closing
- —
- Monthly P&I
- —
- Monthly cashflow
- —
- DSCR
- —
- Eligible?
- —
Short-term bridge; refi at stabilization.
Rent comps 1 comps
| Address | Beds | Baths | Sqft | Rent | $/sqft | DOM | Units | Dist |
|---|---|---|---|---|---|---|---|---|
| 302 American Greeting Card Rd Unit 123-2 Corbin, KY | 2.0 | 2.5 | 1200 | $1,000 | $0.83 | 43d | 1 | 0.78mi |
Listing history 13 events
-
2026-06-09status $99,000 Pending 12 DOM
-
2026-06-08days on market $99,000 Active 12 DOM
-
2026-06-07days on market $99,000 Active 11 DOM
-
2026-06-07pricestatusdays on market $99,000 Active 10 DOM
-
2026-06-04days on market $110,000 Contingent 7 DOM
-
2026-06-02statusdays on market $110,000 Contingent 6 DOM
-
2026-06-01days on market $110,000 Active 5 DOM
-
2026-05-31days on market $110,000 Active 4 DOM
-
2026-05-31days on market $110,000 Active 3 DOM
-
2026-05-19price $120,000 402-char remark
-
2026-04-22price $125,000 402-char remark
-
2026-04-08$139,000 Active 402-char remark
-
1994-06-01soldstatus $41,000
ⓘ Source: listings_history table (triggers on properties + properties_extension) + one-shot
backfill from property_details.listing_events for pre-trigger history.
Tax reassessment forecast KY · Resets to sale price
- Current annual tax
- $292 · $24/mo
- Projected year-2 tax
- $851 · $71/mo
- Expected delta
- +$560/yr (+$47/mo · 191.8%)
ⓘ Screening estimate from a state-policy table — verify with the county assessor before closing.
Climate risk First Street
- Flood 1/10 Low FEMA zone X (unshaded) · 0% chance over 30 yrs
- Wildfire 3/10 Moderate
- Heat 4/10 Moderate 7 d/yr ≥100°F today · 19 d/yr by 30 yrs out
- Wind 2/10 Low 3% chance of damaging wind over 30 yrs
- Air quality 2/10 Low 0 unhealthy d/yr today · 1 by 30 yrs out
Nearby sold comps map
Loading sold comps map…
Walkable amenities ~0.75 mi
Loading nearby amenities…
Taxation est. · year 1
- Rental income
- $12,000
- − Mortgage interest
- −$5,546
- − Property taxes
- −$292
- − Insurance
- −$495
- − Repairs & maintenance
- −$960
- − Management
- −$960
- − Depreciation
- −$2,880
- Taxable income
- $868
- Est. tax owed @ 24.0%
- −$208
- After-tax cash flow
- $2,255/yr
For passive investors: Depreciation is non-cash, so a rental often shows a tax loss while cash-flowing — sheltering income. Rental losses are passive: they offset passive income freely, and up to $25,000/yr can offset ordinary (W-2) income if you actively participate and your MAGI is under $100k (phasing out to $0 by $150k); unused losses carry forward. On sale, claimed depreciation is recaptured at up to 25%, and gains may owe capital-gains tax (a 1031 exchange can defer both). Figures are a year-1 estimate at your 24.0% rate — not tax advice; consult a CPA.
Schools (NCES district)
- District
- Laurel County
- NCES district ID
- 2103210
- Math proficiency
- 51% ▼ -9.00%
- Reading proficiency
- 56% ▼ -11.00%
- Median HH income
- $36,577
- Composite
- 44.39/100
- National rank
- #2814
- State rank
- #8 of 165 in KY
Livability — London
- Score
- 68/100
- State rank
- #202
- US rank
- #10028
Category grades
Schools grade is shown separately in the Schools card above.
Census & demographics
- Population (ZIP)
- 29,767
Population outlook (Laurel County) Hauer SSP2
- Today (2025)
- 62,602 people
- By 2030
- 63,310 · +1.1%
- By 2040
- 63,706 · +1.8%
- By 2050
- 62,705 · +0.2%
- By 2075
- 58,574 · -6.4%
- By 2100
- 50,888 · -18.7%
Race, ethnicity, and origin ACS 2023
- Neighborhood character
- Predominantly White (95%)
- Race & ethnicity
- White 95% Two or more races 3% Hispanic / Latino 1%
- Common ancestry
- Serbian 2% Slovak 2% Italian 1%
- Foreign-born
- 1% · Canada
- Languages at home
- 99% English-only · Spanish 1%
Political lean MEDSL · Laurel
- 2024 margin
- Solid R (+69.9) · D 14.5% · R 84.3% · Other 1.2%
- 2008→2024 swing
- -11.9pp toward R · 2008: -58.0pp · 2024: -69.9pp
- All cycles
- 2024: R+69.9 2020: R+66.7 2016: R+69.1 2012: R+63.6 2008: R+58.0
Not yet ingested
- Civics
- —
Market trends
- HPI YoY
- ▲ 1.82%
- Current HPI
- 294.7961
- Rent YoY
- —
- Metro
- —
- State GDP YoY
- ▲ 1.81%
- F500 in state
- 4
Industry mix (Fortune 500 HQ in KY)
| Industry | F500 HQs | Revenue |
|---|---|---|
| Healthcare | 1 | $118B |
|
||
| Food / Beverage | 1 | $7B |
|
||
Price history
+85.4% since first listed11 events — show timeline
- 2026-06-13 Sold (MLS) $76,000 ImagineMLS
- 2026-06-08 Pending — ImagineMLS
- 2026-06-05 Relisted — ImagineMLS
- 2026-06-05 Price Changed $99,000 ImagineMLS
- 2026-06-02 Contingent — ImagineMLS
- 2026-05-27 Listing Removed — ImagineMLS
- 2026-05-19 Price Changed $120,000 ImagineMLS
- 2026-04-22 Price Changed $125,000 ImagineMLS
- 2026-04-08 Listed $139,000 ImagineMLS
- 2026-04-08 Listed $110,000 ImagineMLS
- 1994-06-01 Sold (Public Records) $41,000 Public Records
Property tax history
+5.1%/yrLatest (2025): $292 · +0.9% YoY. Source: county tax records.
Cash-flow waterfall
monthlySold comps — $/sqft
last 12 mo · ≤1 miLoading sold comps…