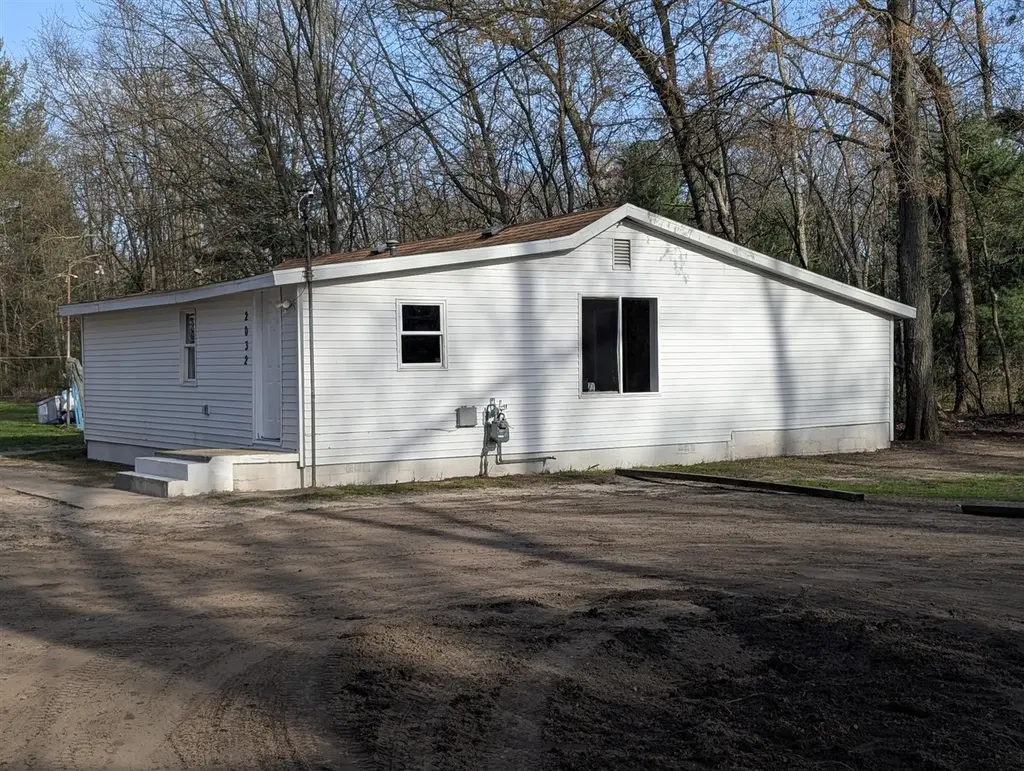
2032 S Mill Iron Rd
Muskegon, MI 49442
$174,900D+
2 bd · 1.0 ba ·
1,288 sqft ·
Built 1945
· SingleFamily
· Active
· 58 DOM
Cashflow @ list (25.0% down · 7.5%)
Estimated rent
$1,322/mo
Mortgage (P&I)
−$917
Tax + insurance
−$137
HOA
−$0
Vac / Maint / Mgmt
−$278
Net cashflow
$-10/mo
Annual
$-114/yr
Cap rate
6.23%
Cash-on-cash
-0.23%
DSCR
0.99
1% rule
0.76%
Cash to close
$48,972
Investor read
- This is a 2-bed/1.0-bath single-family listed at $175k.
- At list price, monthly cash flow is $-10 ($-114/yr) — negative.
- To cash-flow at today's rent, offer at most $173k (1.0% below list).
- To meet the 1% rule (rent ≥ 1% of price), the offer needs to be $132k (24.4% below list).
- It's been on market 58 days — a 3% lower offer ($170k) is reasonable based on typical stale-listing flexibility.
- Recommended offer: $132k (24.4% below list) — sets the bar for 1% rule.
- Local home prices are declining (-3.0%/yr); year-one equity from $1k of loan paydown is wiped out by about $5k of value loss. Plan a longer hold.
- Location reads 79/100 on livability (#92 in MI, #2,096 nationally) — a middle-class / working-renter tenant base. Strengths: amenities A+, commute A+, cost of living A+; Watch: schools D-, crime F, employment F.
- Orchard View Schools (rural): math 12% / reading 25% proficiency, ranked #479 of 540 in MI (top 89%) — low school quality limits family demand, transient renter base, plan for 1-2y turnover; 63% free/reduced lunch — lower-income household profile, screen leases tightly.
- Watch-outs: built in 1945 — expect roof / HVAC / electrical / plumbing capex.
- Market conditions: Rents rising fast (+8.2%/yr); 289 active listings in the ZIP; 1 comparable units currently listed for rent nearby; 438 units permitted in Muskegon County in 2024 (115 in 5+ unit buildings).
- Muskegon County population projected to shrink 8% by 2050 — rents likely to lag national; underwrite the cash flow, not the appreciation.
- 6 sale attempts since 6y ago with the ask held roughly flat each time — persistent listings suggest the price (not the market) is what's stuck; bring a comps-based counter.
- Current owner paid $6k; list at $175k implies a 3023% gain — meaningful room to come down on a strong offer.
- Cap rate 6.2% vs local median 4.6% in Muskegon — top-decile yield for the area; either an underpriced asset or a hidden risk that comps aren't pricing in. Stress-test before assuming the spread holds.
- This rent runs 33% of the median local income ($49k/yr) — at the standard rent-burdened threshold; future hikes will face affordability resistance.
Questions for listing agent
- What do current leases actually rent for vs. the listed asking? Can we see a recent rent roll and the last 12 months of T-12 income?
- It's been on market 58 days. Have you received any prior offers? Is the seller open to a 24% concession, seller financing, or rate buy-down credit?
- Built in 1945 — when were the roof, HVAC, electrical panel, plumbing, and water heater last replaced?
- Is there a deadline driving the sale (1031 exchange, divorce, estate, relocation)? That informs how much negotiation room exists.
- Schools are D-rated, which usually means shorter tenancies and higher turnover. Who's the typical renter profile here, and what's been the actual vacancy rate?
- Crime grade is F in this area — have there been break-ins, vandalism, or insurance claims at this property in the last 3 years? What carrier currently insures it and at what premium?
- The area grade is low — what's the realistic commute time and amenity access for the typical tenant pool here? Any planned neighborhood developments (good or bad) we should know about?
- What's the average days-on-market for RENTAL listings here right now (not sales)? A rising rental-DOM trend means longer vacancies and softer asking-rent achievability than the comps imply.
CashFlowRE · CFR-TNASC7EEMTZP6T
· Data 1 day ago
cashflowre.app · 2026-05-29