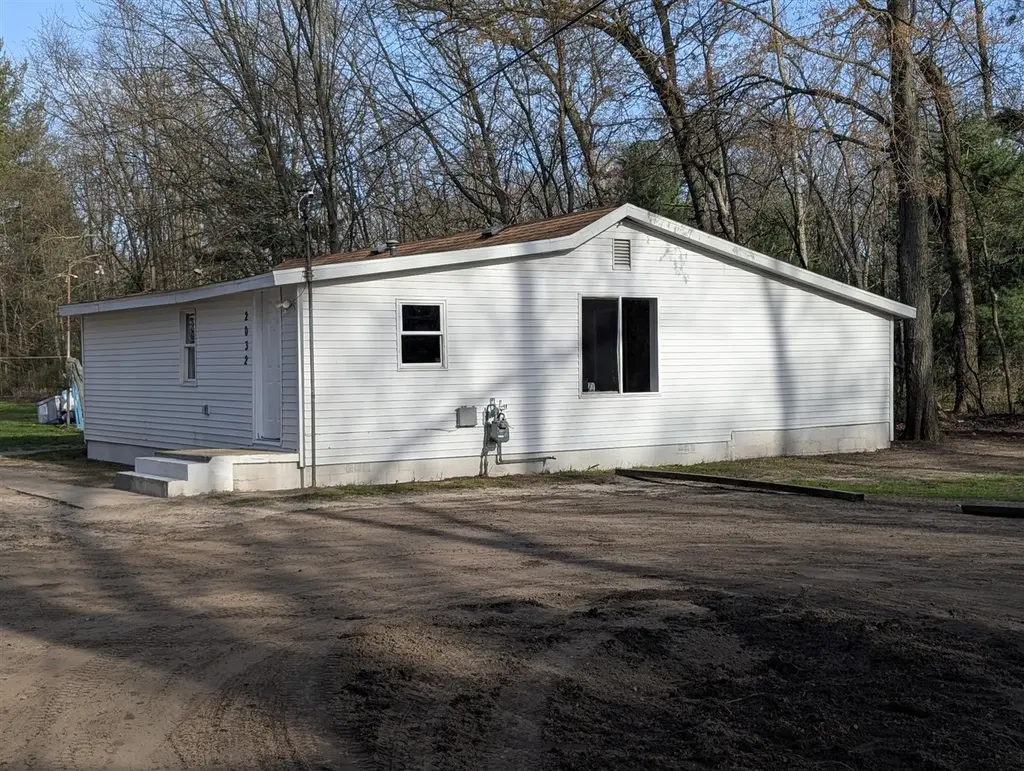
2032 S Mill Iron Rd · Muskegon, MI
Flood risk 1/10 · Minimal
- FEMA flood zone
- X (unshaded)
- Chance of flooding over 30 yrs
- 0.0%
- Est. flood insurance / yr
- $507 – $1,088
Fire risk 1/10 · Minimal
- Est. fire insurance / yr
- $784 – $1,456
Heat risk 1/10 · Minimal
- Hot days now (above 93°F)
- 7 days/yr
- Hot days in 30 yrs
- 14 days/yr
Wind risk 1/10 · Minimal
- Chance of severe wind over 30 yrs
- —
Air-quality risk 4/10 · Minor
- Unhealthy air days now
- 4 days/yr
- Unhealthy air days in 30 yrs
- 6 days/yr
Risk factors via First Street. Map © Google.
Why this score? — see what drove the D+ grade
The composite is a weighted blend of 9 inputs, each scored 0–100. Each bar is that input's sub-score; the figure is the points it added to the 100-point composite (weight × sub-score).
- ARV discount +14.9/15.0
- Cash flow +13.0/30.0
- Rent growth +4.6/5.0
- Livability +4.0/5.0
- DSCR +3.9/10.0
- 1% rule +2.6/10.0
- Condition / age +2.5/5.0
- Schools +1.5/10.0
- Appreciation +0.0/10.0
$174,900
🖨 Deal sheet 📄 Offer letter ✓ Due diligence
Listing remarks MLS
Way off the road is this secluded 4 bedroom home with a large yard that goes deep in the woods. Main floor laundry. Sellers did most of the renovations so that you can move right in. Everything works and is ready for your improvements. Garage needs work. Includes a camper storage carport. EXTRA WELL for garden needs pump.
Key facts
- Extra well
- Large yard
- Main floor laundry
Tags
Neighborhood map
What this means for you Summary
Snapshot
- This is a 2-bed/1.0-bath single-family listed at $175k.
Deal economics
- At list price, monthly cash flow is $-10 ($-114/yr) — negative.
- To cash-flow at today's rent, offer at most $173k (1.0% below list).
- To meet the 1% rule (rent ≥ 1% of price), the offer needs to be $132k (24.4% below list).
- Recommended offer: $132k (24.4% below list) — sets the bar for 1% rule.
- Cap rate 6.2% vs local median 4.6% in Muskegon — top-decile yield for the area; either an underpriced asset or a hidden risk that comps aren't pricing in. Stress-test before assuming the spread holds.
Location & tenants
- Location reads 79/100 on livability (#92 in MI, #2,096 nationally) — a middle-class / working-renter tenant base. Strengths: amenities A+, commute A+, cost of living A+; Watch: schools D-, crime F, employment F.
- Orchard View Schools (rural): math 12% / reading 25% proficiency, ranked #479 of 540 in MI (top 89%) — low school quality limits family demand, transient renter base, plan for 1-2y turnover; 63% free/reduced lunch — lower-income household profile, screen leases tightly.
- Market conditions: Rents rising fast (+8.2%/yr); 289 active listings in the ZIP; 1 comparable units currently listed for rent nearby; 438 units permitted in Muskegon County in 2024 (115 in 5+ unit buildings).
- This rent runs 33% of the median local income ($49k/yr) — at the standard rent-burdened threshold; future hikes will face affordability resistance.
Forward outlook
- Local home prices are declining (-3.0%/yr); year-one equity from $1k of loan paydown is wiped out by about $5k of value loss. Plan a longer hold.
- Muskegon County population projected to shrink 8% by 2050 — rents likely to lag national; underwrite the cash flow, not the appreciation.
Negotiation context
- It's been on market 58 days — a 3% lower offer ($170k) is reasonable based on typical stale-listing flexibility.
- 6 sale attempts since 6y ago with the ask held roughly flat each time — persistent listings suggest the price (not the market) is what's stuck; bring a comps-based counter.
- Current owner paid $6k; list at $175k implies a 3023% gain — meaningful room to come down on a strong offer.
Risks & watch-outs
- Watch-outs: built in 1945 — expect roof / HVAC / electrical / plumbing capex.
Questions for the listing agent
- What do current leases actually rent for vs. the listed asking? Can we see a recent rent roll and the last 12 months of T-12 income?
- It's been on market 58 days. Have you received any prior offers? Is the seller open to a 24% concession, seller financing, or rate buy-down credit?
- Built in 1945 — when were the roof, HVAC, electrical panel, plumbing, and water heater last replaced?
- Is there a deadline driving the sale (1031 exchange, divorce, estate, relocation)? That informs how much negotiation room exists.
- Schools are D-rated, which usually means shorter tenancies and higher turnover. Who's the typical renter profile here, and what's been the actual vacancy rate?
- Crime grade is F in this area — have there been break-ins, vandalism, or insurance claims at this property in the last 3 years? What carrier currently insures it and at what premium?
- The area grade is low — what's the realistic commute time and amenity access for the typical tenant pool here? Any planned neighborhood developments (good or bad) we should know about?
- What's the average days-on-market for RENTAL listings here right now (not sales)? A rising rental-DOM trend means longer vacancies and softer asking-rent achievability than the comps imply.
- What's the recent tenant-quality profile in this submarket — average credit score on applications, eviction rate, late-payment / NSF rate, and stable-employment percentage? A property-management company in the area should have these aggregated.
- How much new for-sale + rental construction is in the pipeline within 1–3 miles? Heavy new supply typically softens prices + rents 12–24 months out; constrained supply supports both.
Investment metrics
- 1% rule
- 0.76% ✗
- Cap rate
- 6.23%
- Cash-on-cash
- -0.23%
- DSCR
- 0.99
- GRM
- 11.0
CMA / ARV
- ARV (median comp)
- $209,539
- List price
- $174,900
- Delta
- -16.53%
- Verdict
- UNDERPRICED
- Comps
- 20 within 1.0 mi
Show comp detail 7 sales within ~0.75 mi
| Address | Dist | Beds/Ba | Sqft | Sold | Price | $/sf | Match |
|---|---|---|---|---|---|---|---|
| 3878 E Laketon Ave | 0.38mi | 3/2.0 (+1) | 1,298 (+1%) | 8mo | $286,000 | $220 | 66 |
| 2096 S Mill Iron Rd | 0.15mi | 3/1.0 (+1) | 1,128 (-12%) | 2mo | $226,600 | $201 | 65 |
| 1921 S Mill Iron Rd | 0.22mi | 3/1.5 (+1) | 1,350 (+5%) | 18mo | $250,000 | $185 | 60 |
| 3320 Evanston Ave | 0.54mi | 3/1.0 (+1) | 1,309 (+2%) | 13mo | $220,000 | $168 | 56 |
| 2275 Shorrock St | 0.63mi | 3/2.0 (+1) | 1,233 (-4%) | 3mo | $292,500 | $237 | 52 |
| 3188 Evanston Ave | 0.70mi | 3/1.0 (+1) | 1,271 (-1%) | 18mo | $190,000 | $149 | 45 |
| 4059 Crestview Ln | 0.42mi | 3/2.0 (+1) | 1,176 (-9%) | 24mo | $84,500 | $72 | 37 |
Match score weights: distance 35% · size 25% · config 20% · recency 20%. Top-matched comps best support the ARV.
Projected returns pro-forma
-3.0% appreciation · 8.0% rent growth · sell at horizon
- IRR
- -11.9%
- Equity multiple
- 0.55×
- Total profit
- $-22,036
- Equity at exit
- $26,078
- IRR
- 2.7%
- Equity multiple
- 1.24×
- Total profit
- $11,527
- Equity at exit
- $15,122
Cash invested: $48,972 (down + closing). Projections, not guarantees.
Landlord ↔ Tenant lean methodology
- Overall (STATE)
- 62 Landlord-Friendly
- State Michigan
- 62 Landlord-Friendly · EVEN
- County
- — inherits STATE
- City
- — inherits STATE
ZIP-level market 49442
- Rents YoY
- 8.2%
- Active inventory
- 289
- Price-to-rent
- 11.0×
Monthly cashflow live
- Estimated rent
- $1,322 medium interval (Pro) →
- Mortgage (P&I)
- −$917
- Tax from tax record
- −$64 /mo · $767/yr
- Insurance
- −$73
- HOA
- −$0
- Vacancy / Maint / Mgmt
- −$278
- Net cashflow
- $-10
Break-even live
UW: 25.0% down · 7.5% · 30yr · 1.5% tax · 5.0% vac · 8.0% maint · 8.0% mgmt
Financing live
Cash to close
- Down payment
- $43,725
- Closing costs
- $5,247
- Reserves months
- —
- Total cash needed
- —
Loan-product check · same deal, 3 products live
Conventional
25% down · 7.5% · 30yr
- Down + closing
- —
- Monthly P&I
- —
- Monthly cashflow
- —
- DSCR
- —
- Eligible?
- —
Personal DTI + credit; lowest rate.
DSCR
20% down · 8.5% · 30yr
- Down + closing
- —
- Monthly P&I
- —
- Monthly cashflow
- —
- DSCR
- —
- Eligible?
- —
No personal income docs; deal must DSCR.
Hard money
10% down · 12.0% · 12mo
- Down + closing
- —
- Monthly P&I
- —
- Monthly cashflow
- —
- DSCR
- —
- Eligible?
- —
Short-term bridge; refi at stabilization.
Rent comps 1 comps
| Address | Beds | Baths | Sqft | Rent | $/sqft | DOM | Units | Dist |
|---|---|---|---|---|---|---|---|---|
| 2129 Arrowhead Dr Muskegon, MI | 3.0 | 2.0 | 1216 | $1,299 | $1.07 | 10d | 1 | 0.50mi |
Listing history 27 events
-
2026-06-19days on market $174,900 Active 58 DOM
-
2026-06-18days on market $174,900 Active 57 DOM
-
2026-06-17days on market $174,900 Active 56 DOM
-
2026-06-16days on market $174,900 Active 55 DOM
-
2026-06-15days on market $174,900 Active 54 DOM
-
2026-06-14days on market $174,900 Active 52 DOM
-
2026-06-13days on market $174,900 Active 51 DOM
-
2026-06-10days on market $174,900 Active 49 DOM
-
2026-06-09days on market $174,900 Active 48 DOM
-
2026-06-08days on market $174,900 Active 47 DOM
-
2026-06-07days on market $174,900 Active 46 DOM
-
2026-06-05days on market $174,900 Active 43 DOM
-
2026-06-03days on market $174,900 Active 42 DOM
-
2026-06-02days on market $174,900 Active 41 DOM
-
2026-06-01days on market $174,900 Active 40 DOM
-
2026-05-31days on market $174,900 Active 39 DOM
-
2026-05-30days on market $174,900 Active 38 DOM
-
2026-04-22$174,900 Active 323-char remark
Show marketing remark (323 chars)
Way off the road is this secluded 4 bedroom home with a large yard that goes deep in the woods. Main floor laundry. Sellers did most of the renovations so that you can move right in. Everything works and is ready for your improvements. Garage needs work. Includes a camper storage carport. EXTRA WELL for garden needs pump.
-
2026-04-22$174,900 Active
Show marketing remark (323 chars)
Way off the road is this secluded 4 bedroom home with a large yard that goes deep in the woods. Main floor laundry. Sellers did most of the renovations so that you can move right in. Everything works and is ready for your improvements. Garage needs work. Includes a camper storage carport. EXTRA WELL for garden needs pump.
-
2020-11-12soldstatus $5,600
-
2020-11-12soldstatus $5,600 Sold
-
2020-08-24status Pending
-
2020-03-19$6,000
-
2020-03-19$6,000 Active
-
2020-03-19$6,000
-
1996-05-03soldstatus $25,000
ⓘ Source: listings_history table (triggers on properties + properties_extension) + one-shot
backfill from property_details.listing_events for pre-trigger history.
Tax reassessment forecast MI · Partial reset (capped growth)
- Current annual tax
- $767 · $64/mo
- Projected year-2 tax
- $1,730 · $144/mo
- Expected delta
- +$963/yr (+$80/mo · 125.6%)
ⓘ Screening estimate from a state-policy table — verify with the county assessor before closing.
Climate risk First Street
- Flood 1/10 Low FEMA zone X (unshaded) · 0% chance over 30 yrs
- Wildfire 1/10 Low
- Heat 1/10 Low 7 d/yr ≥93°F today · 14 d/yr by 30 yrs out
- Wind 1/10 Low
- Air quality 4/10 Moderate 4 unhealthy d/yr today · 6 by 30 yrs out
Nearby sold comps map
Loading sold comps map…
Walkable amenities ~0.75 mi
Loading nearby amenities…
Taxation est. · year 1
- Rental income
- $15,865
- − Mortgage interest
- −$9,797
- − Property taxes
- −$767
- − Insurance
- −$874
- − Repairs & maintenance
- −$1,269
- − Management
- −$1,269
- − Depreciation
- −$5,088
- Taxable loss
- −$3,200
- Est. tax savings @ 24.0%
- +$768
- After-tax cash flow
- $654/yr
For passive investors: Depreciation is non-cash, so a rental often shows a tax loss while cash-flowing — sheltering income. Rental losses are passive: they offset passive income freely, and up to $25,000/yr can offset ordinary (W-2) income if you actively participate and your MAGI is under $100k (phasing out to $0 by $150k); unused losses carry forward. On sale, claimed depreciation is recaptured at up to 25%, and gains may owe capital-gains tax (a 1031 exchange can defer both). Figures are a year-1 estimate at your 24.0% rate — not tax advice; consult a CPA.
Schools (NCES district)
- District
- Orchard View Schools
- NCES district ID
- 2626760
- Math proficiency
- 12% ▼ -8.00%
- Reading proficiency
- 25% ▼ -4.00%
- Median HH income
- $37,637
- Composite
- 15.44/100
- National rank
- #9314
- State rank
- #479 of 540 in MI
Livability — Muskegon
- Score
- 79/100
- State rank
- #92
- US rank
- #2096
Category grades
Schools grade is shown separately in the Schools card above.
Census & demographics
- County
- Muskegon County · 107,917 people
- City population
- 44,766
- Metro
- Muskegon, MI
- Population (ZIP)
- 44,766
- Household income
- $48,563
- Rent vs Own
- Severe rent burden
- 1598.0
Population outlook (Muskegon County) Hauer SSP2
- Today (2025)
- 174,032 people
- By 2030
- 173,365 · -0.4%
- By 2040
- 168,877 · -3.0%
- By 2050
- 160,306 · -7.9%
- By 2075
- 134,426 · -22.8%
- By 2100
- 98,836 · -43.2%
Race, ethnicity, and origin ACS 2023
- Neighborhood character
- Diverse neighborhood (Simpson 0.56)
- Race & ethnicity
- White 63% Black 22% Two or more races 10% Hispanic / Latino 8%
- Hispanic origin (detail)
- Mexican 7%
- Common ancestry
- Iranian 5% Romanian 4% Lithuanian 3%
- Foreign-born
- 3% · Canada, South Korea
- Languages at home
- 95% English-only · Spanish 3%
Political lean MEDSL · Muskegon
- 2024 margin
- Toss-up / Even · D 48.4% · R 50.2% · Other 1.5%
- 2008→2024 swing
- -31.1pp toward R · 2008: 29.3pp · 2024: -1.8pp
- All cycles
- 2024: R+1.8 2020: D+0.6 2016: D+0.9 2012: D+17.8 2008: D+29.3
Not yet ingested
- Civics
- —
Market trends
- HPI YoY
- ▼ -174.87%
- Current HPI
- 287.0558
- Rent YoY
- ▲ 8.21%
- Metro
- Muskegon, MI
- State GDP YoY
- ▲ 1.37%
- F500 in state
- 28
Industry mix (Fortune 500 HQ in MI)
| Industry | F500 HQs | Revenue |
|---|---|---|
| Automotive Parts | 3 | $48B |
|
||
| Automotive | 2 | $372B |
|
||
| Chemicals | 1 | $45B |
|
||
| Automotive Retail | 1 | $29B |
|
||
| Healthcare / Medical Devices | 1 | $23B |
|
||
| Automotive Technology | 1 | $20B |
|
||
Price history
+599.6% since first listed10 events — show timeline
- 2026-04-22 Listed $174,900 REALCOMP
- 2026-04-22 Listed $174,900 MiRealSource-MiMLS
- 2026-04-22 Listed $174,900 SW Michigan MLS
- 2020-11-12 Sold (MLS) $5,600 SW Michigan MLS
- 2020-11-12 Sold (MLS) $5,600 REALCOMP
- 2020-08-24 Pending — SW Michigan MLS
- 2020-03-19 Listed $6,000 MiRealSource-MiMLS
- 2020-03-19 Listed $6,000 SW Michigan MLS
- 2020-03-19 Listed $6,000 REALCOMP
- 1996-05-03 Sold (Public Records) $25,000 Public Records
Property tax history
+3.3%/yrLatest (2025): $767 · +3.7% YoY. Source: county tax records.
Cash-flow waterfall
monthlySold comps — $/sqft
last 12 mo · ≤1 miLoading sold comps…