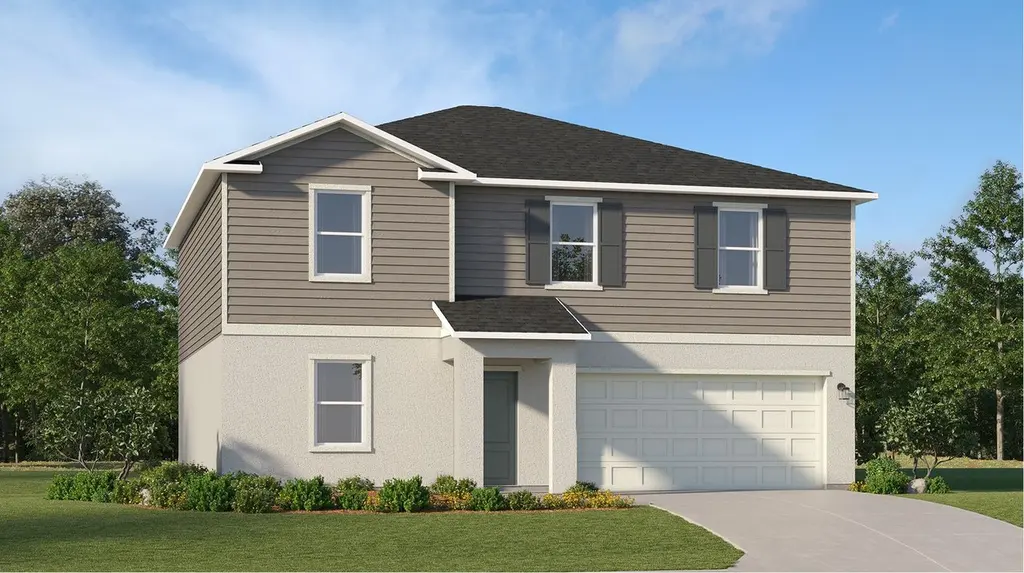
4830 NW 16th Ln
Rainbow Park, FL 34482
$337,990F
5 bd · 3.5 ba ·
2,451 sqft ·
Built 2026
· SingleFamily
· Pending
· 28 DOM
Cashflow @ list (25.0% down · 7.5%)
Estimated rent
$2,501/mo
Mortgage (P&I)
−$2,676
Tax + insurance
−$851
HOA
−$46
Vac / Maint / Mgmt
−$525
Net cashflow
$-1,597/mo
Annual
$-19,164/yr
Cap rate
2.54%
Cash-on-cash
-13.41%
DSCR
0.40
1% rule
0.49%
Cash to close
$142,899
Investor read
- This is a 5-bed/3.5-bath single-family listed at $338k. Condition is rated good.
- At list price, monthly cash flow is $-2k ($-19k/yr) — negative.
- To cash-flow at today's rent, offer at most $279k (17.4% below list).
- To meet the 1% rule (rent ≥ 1% of price), the offer needs to be $250k (26.0% below list).
- It's been on market 28 days — a 2% lower offer ($333k) is reasonable based on typical stale-listing flexibility.
- Recommended offer: $250k (26.0% below list) — sets the bar for 1% rule.
- Local home prices are declining (-3.0%/yr); year-one equity from $4k of loan paydown is wiped out by about $15k of value loss. Plan a longer hold.
- Location reads: area grade F — affects rentability + tenant quality, not the cash-flow math above.
- Marion (rural): math 42% / reading 43% proficiency, ranked #61 of 73 in FL (top 84%) — families likely to look elsewhere, expect single-tenant / working-renter base with shorter leases; 61% free/reduced lunch — lower-income household profile, screen leases tightly.
- Zoned schools: College Park Elementary School (math 46% / reading 37%, grade F, #1,437 of 2,144 statewide, top 68%, 840 students, 78% FRL); Dunnellon Middle School (math 48% / reading 42%, grade D, #310 of 571 statewide, top 56%, 678 students, 68% FRL); West Port High School (math 34% / reading 52%, grade F, #255 of 667 statewide, top 39%, 2,906 students, 52% FRL) — zoned schools at 66% FRL track the district average.
- Market conditions: Rents rising fast (+11.1%/yr); 670 active listings in the ZIP; 7,071 units permitted in Marion County in 2024 (534 in 5+ unit buildings).
- Marion County population projected at +13% by 2050 — modest demand growth; plan on rents tracking national, not racing it.
- Cap rate 2.5% vs local median 5.7% in Rainbow Park — below-typical yield; the buyer is paying a premium for something (appreciation thesis, condition, location) that the cap rate doesn't capture.
- At $2,501/mo this rent would consume 46% of the median local household income ($66k/yr) (locally 282% of renters already pay >50% of income on rent) — very limited rent-growth headroom before tenants either downsize or default.
Questions for listing agent
- What do current leases actually rent for vs. the listed asking? Can we see a recent rent roll and the last 12 months of T-12 income?
- What does the HOA fee cover, when was the last increase, and are there any pending special assessments or reserve-fund shortfalls?
- Is there a deadline driving the sale (1031 exchange, divorce, estate, relocation)? That informs how much negotiation room exists.
- The area grade is low — what's the realistic commute time and amenity access for the typical tenant pool here? Any planned neighborhood developments (good or bad) we should know about?
- What's the average days-on-market for RENTAL listings here right now (not sales)? A rising rental-DOM trend means longer vacancies and softer asking-rent achievability than the comps imply.
- What's the recent tenant-quality profile in this submarket — average credit score on applications, eviction rate, late-payment / NSF rate, and stable-employment percentage? A property-management company in the area should have these aggregated.
- How much new for-sale + rental construction is in the pipeline within 1–3 miles? Heavy new supply typically softens prices + rents 12–24 months out; constrained supply supports both.
CashFlowRE · CFR-TNHWDK2M4VJSQ4
· Data 3 weeks ago
cashflowre.app · 2026-05-29