 🏗️ New Construction
4830 NW 16th Ln · Rainbow Park, FL
Flood risk No data
- FEMA flood zone
- —
- Chance of flooding over 30 yrs
- —
- Est. flood insurance / yr
- —
Fire risk No data
- Est. fire insurance / yr
- —
Heat risk No data
- Hot days now (above threshold)
- —
- Hot days in 30 yrs
- —
Wind risk No data
- Chance of severe wind over 30 yrs
- —
Air-quality risk No data
- Unhealthy air days now
- —
- Unhealthy air days in 30 yrs
- —
Risk factors via First Street. Map © Google.
Why this score? — see what drove the F grade
The composite is a weighted blend of 9 inputs, each scored 0–100. Each bar is that input's sub-score; the figure is the points it added to the 100-point composite (weight × sub-score).
- ARV discount +7.5/15.0
- Rent growth +5.0/5.0
- Condition / age +4.0/5.0
- Schools +3.6/10.0
- Cash flow +3.3/30.0
- Livability +2.5/5.0
- 1% rule +0.0/10.0
- DSCR +0.0/10.0
- Appreciation +0.0/10.0
$337,990
🖨 Deal sheet (PDF) 📄 Offer letter ✓ Due diligence
Listing remarks
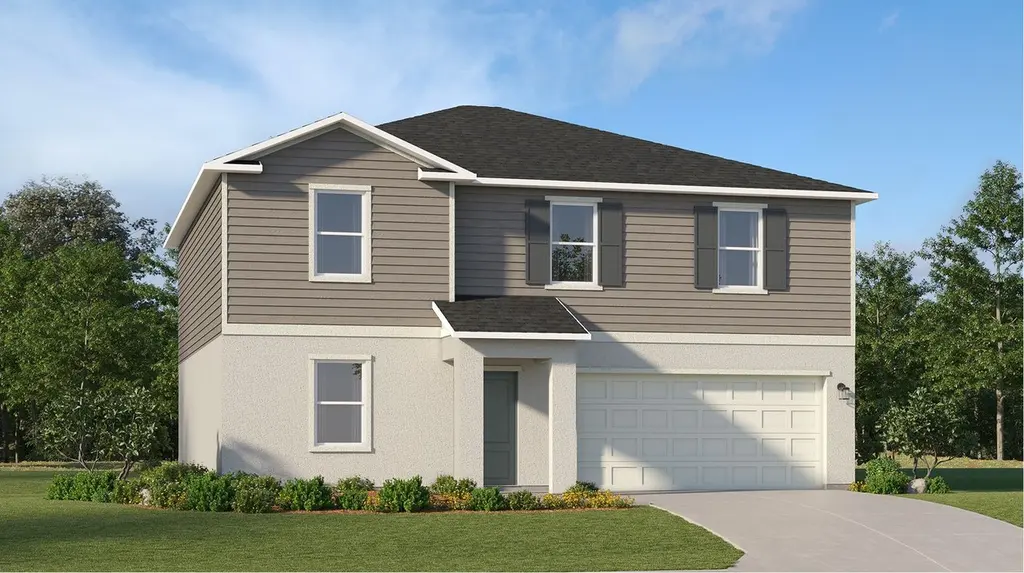
Under Construction. The first floor of this two-story home shares an open layout between the kitchen, dining area and family room for easy entertaining with access to the patio. A secondary bedroom on the first floor can easily be converted to a guest room or home office. Upstairs is a versatile loft that serves as an additional shared living space, along with three secondary bedrooms and a peaceful owner's suite comprised of an en-suite bathroom and a large walk-in closet.
Key facts
- Guest room
- Access to patio
- Open layout
Tags
Property features AI
Finance
- Other: Property is in a PUD zoning; Lot approx. 0.18 acre
- HOA & community: HOA managed by Triad Management; HOA required; $555 annually ($46.25/month); Pets allowed
Exterior
- Parking: Attached 2-car garage
- Utilities: Public water; Public sewer; Public utilities
- Home design: Single family residence; One-story; New construction (projected completion July 24, 2026); North-facing
- Construction: Block construction; Shingle roof; Slab foundation; Built by Lennar Homes (Model: Eclipse); Under construction
- Exterior features: Paved road access
Interior
- Kitchen: Dishwasher; Disposal
- Bedrooms: 5 bedrooms
- Flooring: Carpet
- Bathrooms: 3 full bathrooms; 1 half bathroom
- Heating & cooling: Heat pump; Central air
- Interior features: Walk-in closets; Sliding doors
- Laundry & utility: Dedicated laundry room
Neighborhood map
What this means for you Summary
Snapshot
- This is a 5-bed/3.5-bath single-family listed at $338k. Condition is rated good.
Deal economics
- At list price, monthly cash flow is $-2k ($-19k/yr) — negative.
- To cash-flow at today's rent, offer at most $279k (17.4% below list).
- To meet the 1% rule (rent ≥ 1% of price), the offer needs to be $250k (26.0% below list).
- Recommended offer: $250k (26.0% below list) — sets the bar for 1% rule.
- Cap rate 2.5% vs local median 5.7% in Rainbow Park — below-typical yield; the buyer is paying a premium for something (appreciation thesis, condition, location) that the cap rate doesn't capture.
Location & tenants
- Location reads: area grade F — affects rentability + tenant quality, not the cash-flow math above.
- Marion (rural): math 42% / reading 43% proficiency, ranked #61 of 73 in FL (top 84%) — families likely to look elsewhere, expect single-tenant / working-renter base with shorter leases; 61% free/reduced lunch — lower-income household profile, screen leases tightly.
- Zoned schools: College Park Elementary School (math 46% / reading 37%, grade F, #1,437 of 2,144 statewide, top 68%, 840 students, 78% FRL); Dunnellon Middle School (math 48% / reading 42%, grade D, #310 of 571 statewide, top 56%, 678 students, 68% FRL); West Port High School (math 34% / reading 52%, grade F, #255 of 667 statewide, top 39%, 2,906 students, 52% FRL) — zoned schools at 66% FRL track the district average.
- Market conditions: Rents rising fast (+11.1%/yr); 670 active listings in the ZIP; 7,071 units permitted in Marion County in 2024 (534 in 5+ unit buildings).
- At $2,501/mo this rent would consume 46% of the median local household income ($66k/yr) (locally 282% of renters already pay >50% of income on rent) — very limited rent-growth headroom before tenants either downsize or default.
Forward outlook
- Local home prices are declining (-3.0%/yr); year-one equity from $4k of loan paydown is wiped out by about $15k of value loss. Plan a longer hold.
- Marion County population projected at +13% by 2050 — modest demand growth; plan on rents tracking national, not racing it.
Negotiation context
- It's been on market 28 days — a 2% lower offer ($333k) is reasonable based on typical stale-listing flexibility.
Questions for the listing agent
- What do current leases actually rent for vs. the listed asking? Can we see a recent rent roll and the last 12 months of T-12 income?
- What does the HOA fee cover, when was the last increase, and are there any pending special assessments or reserve-fund shortfalls?
- Is there a deadline driving the sale (1031 exchange, divorce, estate, relocation)? That informs how much negotiation room exists.
- The area grade is low — what's the realistic commute time and amenity access for the typical tenant pool here? Any planned neighborhood developments (good or bad) we should know about?
- What's the average days-on-market for RENTAL listings here right now (not sales)? A rising rental-DOM trend means longer vacancies and softer asking-rent achievability than the comps imply.
- What's the recent tenant-quality profile in this submarket — average credit score on applications, eviction rate, late-payment / NSF rate, and stable-employment percentage? A property-management company in the area should have these aggregated.
- How much new for-sale + rental construction is in the pipeline within 1–3 miles? Heavy new supply typically softens prices + rents 12–24 months out; constrained supply supports both.
Investment metrics
- 1% rule
- 0.49% ✗
- Cap rate
- 2.54%
- Cash-on-cash
- -13.41%
- DSCR
- 0.40
- GRM
- 17.0
CMA / ARV
- ARV (median comp)
- $510,354
- List price
- $337,990
- Delta
- -33.77%
- Verdict
- UNDERPRICED
- Comps
- 2 within 1.0 mi
Projected returns pro-forma
-3.0% appreciation · 8.0% rent growth · sell at horizon
- IRR
- -36.2%
- Equity multiple
- -0.20×
- Total profit
- $-171,129
- Equity at exit
- $76,095
- IRR
- -27.1%
- Equity multiple
- -0.54×
- Total profit
- $-219,560
- Equity at exit
- $44,126
Cash invested: $142,899 (down + closing). Projections, not guarantees.
Landlord ↔ Tenant lean methodology
- Overall (STATE)
- 87 Strongly Landlord-Friendly
- State Florida
- 87 Strongly Landlord-Friendly · R+3
- County
- — inherits STATE
- City
- — inherits STATE
ZIP-level market 34482
- Rents YoY
- 11.1%
- Active inventory
- 670
- Price-to-rent
- 11.3×
Monthly cashflow live
- Estimated rent
- $2,501 medium interval (Pro) →
- Mortgage (P&I)
- −$2,676
- Tax est. 1.5%
- −$638 /mo · $7,655/yr
- Insurance
- −$213
- HOA
- −$46
- Vacancy / Maint / Mgmt
- −$525
- Net cashflow
- $-1,597
Break-even live
Sensitivity live
| Price | -10% $-1,244 | -5% $-1,421 | +0% $-1,597 | +5% $-1,773 | +10% $-1,950 |
|---|---|---|---|---|---|
| Rent | -10% $-1,795 | -5% $-1,696 | +0% $-1,597 | +5% $-1,498 | +10% $-1,399 |
| Rate | -1.0pp $-1,340 | -0.5pp $-1,467 | base $-1,597 | +0.5pp $-1,729 | +1.0pp $-1,864 |
UW: 25.0% down · 7.5% · 30yr · 1.5% tax · 5.0% vac · 8.0% maint · 8.0% mgmt
Financing live
Cash to close
- Down payment
- $127,589
- Closing costs
- $15,311
- Reserves months
- —
- Total cash needed
- —
Loan-product check · same deal, 3 products live
Conventional
25% down · 7.5% · 30yr
- Down + closing
- —
- Monthly P&I
- —
- Monthly cashflow
- —
- DSCR
- —
- Eligible?
- —
Personal DTI + credit; lowest rate.
DSCR
20% down · 8.5% · 30yr
- Down + closing
- —
- Monthly P&I
- —
- Monthly cashflow
- —
- DSCR
- —
- Eligible?
- —
No personal income docs; deal must DSCR.
Hard money
10% down · 12.0% · 12mo
- Down + closing
- —
- Monthly P&I
- —
- Monthly cashflow
- —
- DSCR
- —
- Eligible?
- —
Short-term bridge; refi at stabilization.
HOA detail
- Monthly dues
- $46 · $552/yr
Listing history 4 events
-
2026-05-13price $337,990 478-char remark
-
2026-05-12price $337,990 458-char remark
-
2026-04-28$349,990 Active 458-char remark
-
2026-04-28$349,990 Active 478-char remark
ⓘ Source: listings_history table (triggers on properties + properties_extension) + one-shot
backfill from property_details.listing_events for pre-trigger history.
Nearby sold comps map
Loading sold comps map…
Walkable amenities ~0.75 mi
Loading nearby amenities…
Taxation est. · year 1
- Rental income
- $30,014
- − Mortgage interest
- −$28,588
- − Property taxes
- −$7,655
- − Insurance
- −$2,552
- − Repairs & maintenance
- −$2,401
- − Management
- −$2,401
- − HOA
- −$552
- − Depreciation
- −$14,847
- Taxable loss
- −$28,982
- Est. tax savings @ 24.0%
- +$6,956
- After-tax cash flow
- $-12,208/yr
For passive investors: Depreciation is non-cash, so a rental often shows a tax loss while cash-flowing — sheltering income. Rental losses are passive: they offset passive income freely, and up to $25,000/yr can offset ordinary (W-2) income if you actively participate and your MAGI is under $100k (phasing out to $0 by $150k); unused losses carry forward. On sale, claimed depreciation is recaptured at up to 25%, and gains may owe capital-gains tax (a 1031 exchange can defer both). Figures are a year-1 estimate at your 24.0% rate — not tax advice; consult a CPA.
Condition & rehab AI · 6 photos
This under-construction home is in good condition with a modern design and ample space. It is ready for immediate occupancy and can be enhanced with minor updates to boost its value.
Value-add opportunities
- Both Painting interior walls — Fresh paint can enhance the home's curb appeal and interior aesthetics.
- Both Landscaping improvements — Enhanced landscaping can increase both resale and rental value.
- Both Add smart home features — Smart home features can increase both resale and rental value by making the home more modern and convenient.
Renovation cost estimate screening
Value-add ROI direction
- Both Painting interior walls — Fresh paint can enhance the home's curb appeal and interior aesthetics. ↑
- Both Landscaping improvements — Enhanced landscaping can increase both resale and rental value. ↑
- Both Add smart home features — Smart home features can increase both resale and rental value by making the home more modern and convenient. ↑
ⓘ Cost ranges are severity-bucket heuristics (US national rule-of-thumb). Get contractor quotes + a written scope before underwriting a rehab budget.
Schools (NCES district)
- District
- Marion
- NCES district ID
- 1201260
- Math proficiency
- 42% ▼ -7.00%
- Reading proficiency
- 43% ▼ -4.00%
- Median HH income
- $40,015
- Composite
- 35.61/100
- National rank
- #4890
- State rank
- #61 of 73 in FL
Livability — Rainbow Park
No livability data for this city. (Only ~50 U.S. cities are tracked.)
Census & demographics
- County
- Marion County · 315,796 people
- Metro
- Ocala, FL
- Population (ZIP)
- 22,807
- Household income
- $65,901
- Rent vs Own
- Severe rent burden
- 282.0
Population outlook (Marion County) Hauer SSP2
- Today (2025)
- 365,905 people
- By 2030
- 376,768 · +3.0%
- By 2040
- 396,555 · +8.4%
- By 2050
- 412,723 · +12.8%
- By 2075
- 446,090 · +21.9%
- By 2100
- 436,193 · +19.2%
Race, ethnicity, and origin ACS 2023
- Neighborhood character
- Majority White (63%)
- Race & ethnicity
- White 63% Hispanic / Latino 19% Black 14% Two or more races 12%
- Hispanic origin (detail)
- Mexican 6% Puerto Rican 9% Cuban 2%
- Common ancestry
- Lithuanian 2% Romanian 2% Slovak 2%
- Foreign-born
- 10% · Canada
- Languages at home
- 81% English-only · Spanish 16% Other Indo-European 1%
Political lean MEDSL · Marion
- 2024 margin
- Solid R (+31.6) · D 33.8% · R 65.5%
- 2008→2024 swing
- -20.0pp toward R · 2008: -11.6pp · 2024: -31.6pp
- All cycles
- 2024: R+31.6 2020: R+25.9 2016: R+26.2 2012: R+16.2 2008: R+11.6
Not yet ingested
- Civics
- —
Market trends
- HPI YoY
- ▼ -133.62%
- Current HPI
- 194.3857
- Rent YoY
- ▲ 11.12%
- Metro
- Ocala, FL
- State GDP YoY
- ▲ 3.28%
- F500 in state
- 36
Industry mix (Fortune 500 HQ in FL)
| Industry | F500 HQs | Revenue |
|---|---|---|
| Industrial Technology | 2 | $29B |
|
||
| Insurance | 2 | $17B |
|
||
| Retail | 1 | $60B |
|
||
| Technology Distribution | 1 | $58B |
|
||
| Homebuilding | 1 | $35B |
|
||
| Technology Manufacturing | 1 | $35B |
|
||
Price history
-3.4% since first listed3 events — show timeline
- 2026-05-26 Pending — Stellar MLS as Distributed by MLS Grid
- 2026-05-13 Price Changed $337,990 Stellar MLS as Distributed by MLS Grid
- 2026-04-28 Listed $349,990 Stellar MLS as Distributed by MLS Grid
Cash-flow waterfall
monthlySold comps — $/sqft
last 12 mo · ≤1 miLoading sold comps…