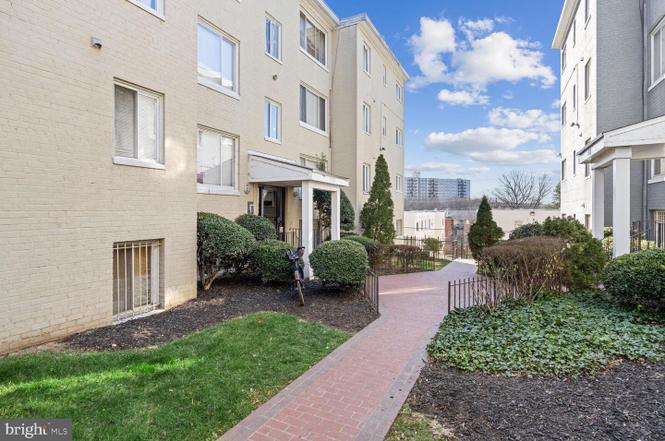
713 Brandywine St SE #203
Washington, DC 20032
$126,000D
2 bd · 1.0 ba ·
655 sqft ·
Built 1953
· Condo
· Active
· 1 DOM
Cashflow @ list (25.0% down · 7.5%)
Estimated rent
$1,489/mo
Mortgage (P&I)
−$661
Tax + insurance
−$132
HOA
−$436
Vac / Maint / Mgmt
−$313
Net cashflow
$-53/mo
Annual
$-633/yr
Cap rate
5.79%
Cash-on-cash
-1.79%
DSCR
0.92
1% rule
1.18%
Cash to close
$35,280
Investor read
- This is a 2-bed/1.0-bath condo listed at $126k.
- At list price, monthly cash flow is $-53 ($-633/yr) — negative.
- To cash-flow at today's rent, offer at most $117k (7.4% below list).
- Meets the 1% rule at list price ($1k rent vs $126k).
- Only 1 days on market — expect competitive offers; lowballing is unlikely to land.
- Recommended offer: $117k (7.4% below list) — sets the bar for cash-flow.
- Local home prices are declining (-3.0%/yr); year-one equity from $871 of loan paydown is wiped out by about $4k of value loss. Plan a longer hold.
- Location reads 73/100 on livability (#1 in DC) — a middle-class / working-renter tenant base. Strengths: amenities A+, commute A+, employment A+; Watch: crime F, cost of living F.
- District Of Columbia Public Schools (urban): math 33% / reading 40% proficiency, ranked #8 of 32 in DC (top 25%) — families likely to look elsewhere, expect single-tenant / working-renter base with shorter leases; 65% free/reduced lunch — lower-income household profile, screen leases tightly.
- Watch-outs: HOA is 29% of rent; built in 1953 — expect roof / HVAC / electrical / plumbing capex.
- Market conditions: Rents rising (+4.0%/yr); 145 active listings in the ZIP; 40 comparable units currently listed for rent nearby; rentals at typical pace (median 24d on market — plan ~3-4 weeks tenant-placement turnaround); 1,737 units permitted in District of Columbia in 2024 (1,506 in 5+ unit buildings).
- District of Columbia County population projected at +50% by 2050 — long-run rental-demand tailwind backs the buy-and-hold thesis.
- 5 sale attempts since 19y ago; this cycle's ask is 9980% above the opening price — seller raised mid-cycle; expect resistance to lowballs.
- Climate carrying-cost: extreme-heat days projected 7→16/yr by 2055 (HVAC capex compounding) — expect insurance premiums to compound above CPI over the hold.
- Cap rate 5.8% vs local median 2.5% in Washington — top-decile yield for the area; either an underpriced asset or a hidden risk that comps aren't pricing in. Stress-test before assuming the spread holds.
- This rent runs 36% of the median local income ($49k/yr) — at the standard rent-burdened threshold; future hikes will face affordability resistance.
Questions for listing agent
- What do current leases actually rent for vs. the listed asking? Can we see a recent rent roll and the last 12 months of T-12 income?
- Built in 1953 — when were the roof, HVAC, electrical panel, plumbing, and water heater last replaced?
- What does the HOA fee cover, when was the last increase, and are there any pending special assessments or reserve-fund shortfalls?
- Any open or pending special assessments — roof, HVAC, plumbing, elevator, façade? What's the per-unit balance and payoff schedule, and is the seller paying it off at close or rolling it to the buyer?
- Is there a deadline driving the sale (1031 exchange, divorce, estate, relocation)? That informs how much negotiation room exists.
- Crime grade is F in this area — have there been break-ins, vandalism, or insurance claims at this property in the last 3 years? What carrier currently insures it and at what premium?
- The area grade is low — what's the realistic commute time and amenity access for the typical tenant pool here? Any planned neighborhood developments (good or bad) we should know about?
- What's the average days-on-market for RENTAL listings here right now (not sales)? A rising rental-DOM trend means longer vacancies and softer asking-rent achievability than the comps imply.
CashFlowRE · CFR-TP8EEJ3PMA1KT7
· Data 2 days ago
cashflowre.app · 2026-05-29