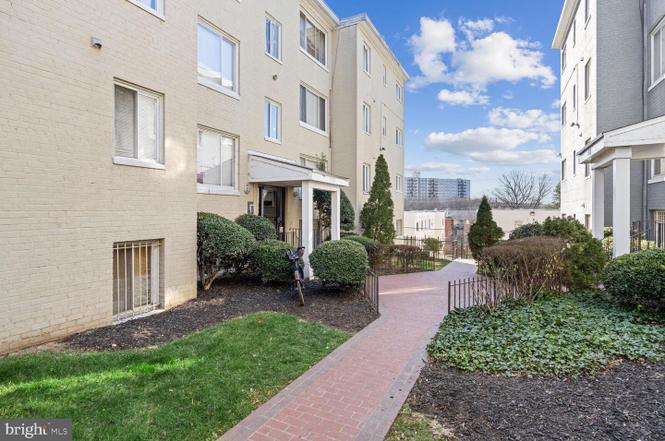
713 Brandywine St SE #203 · Washington, DC
Flood risk 1/10 · Minimal
- FEMA flood zone
- X (unshaded)
- Chance of flooding over 30 yrs
- 0.0%
- Est. flood insurance / yr
- $507 – $1,088
Fire risk 3/10 · Minor
- Est. fire insurance / yr
- $631 – $1,173
Heat risk 8/10 · Major
- Hot days now (above 104°F)
- 7 days/yr
- Hot days in 30 yrs
- 16 days/yr
Wind risk 4/10 · Minor
- Chance of severe wind over 30 yrs
- 17.0%
Air-quality risk 3/10 · Minor
- Unhealthy air days now
- 2 days/yr
- Unhealthy air days in 30 yrs
- 3 days/yr
Risk factors via First Street. Map © Google.
Why this score? — see what drove the D grade
The composite is a weighted blend of 9 inputs, each scored 0–100. Each bar is that input's sub-score; the figure is the points it added to the 100-point composite (weight × sub-score).
- Cash flow +11.0/30.0
- ARV discount +7.5/15.0
- 1% rule +6.8/10.0
- Livability +3.7/5.0
- Schools +3.6/10.0
- Rent growth +3.5/5.0
- DSCR +3.2/10.0
- Condition / age +2.5/5.0
- Appreciation +0.0/10.0
$126,000
🖨 Deal sheet 📄 Offer letter ✓ Due diligence
Listing remarks MLS
If you're looking for a new home, look no further! This spacious 2 bedroom / 1 bathroom condo can surely fit the bill. 713 Brandywine is an investor-friendly condo with lots of natural light and recently updated interiors. The in-unit washer and dryer make laundry easy, and secure off-street parking is included. Conveniently situated near several bus lines, the metro, and easy access to highways into MD and downtown DC all in a well-kept community with an active condo association. Condo fees cover trash removal, snow removal, and all utilities except for gas. Watch your equity grow while awaiting the exciting St. Elizabeths planned redevelopment site and Mins from DHS Campus. Previously rented for $1300/month but can easily be increased to an estimated $1600/month (per DC rental rates) for this well-priced condo! Don't let this investment slip away!
Key facts
- Large windows
- Pantry
- Gas stove
Tags
Property features AI
Finance
- Other: Finished above-grade area: 655 (source: assessor)
- Financial info: Lease considered
- HOA & community: Monthly condo fee of $436.37 (professional off-site management); Condo fee includes trash, snow removal, security gate, parking fee, and water; Pets allowed with number limits
Exterior
- Parking: Assigned parking (Off street), space #21
- Security: Community security gate (included via association)
- Utilities: Public water; Public sewer
- Home design: Garden-style building (1–4 floors); Unit/flat; Flat roof; Entry on level 2; Located in city limits
- Construction: Brick construction; Above grade and below grade structures; Excellent property condition
- Exterior features: Sidewalks; Not in a federal flood zone
Interior
- Kitchen: Built-in microwave; Dishwasher; Disposal; Gas oven/range; Refrigerator
- Bedrooms: 2 bedrooms on main level
- Flooring: Ceramic tile; Wood
- Bathrooms: 1 full bathroom on main level; 1 full bathroom total
- Heating & cooling: Central heating (natural gas); Central air conditioning (electric)
- Interior features: Combination kitchen/dining area; Traditional floor plan; Galley kitchen; Tub/shower; Window treatments; Upgraded countertops; 9'+ ceilings; Wood floors; Other interior features
- Laundry & utility: Washer in unit; Dryer in unit; Washer/dryer hook up in unit; Water heater
Neighborhood map
What this means for you Summary
Snapshot
- This is a 2-bed/1.0-bath condo listed at $126k.
Deal economics
- At list price, monthly cash flow is $-53 ($-633/yr) — negative.
- To cash-flow at today's rent, offer at most $117k (7.4% below list).
- Meets the 1% rule at list price ($1k rent vs $126k).
- Recommended offer: $117k (7.4% below list) — sets the bar for cash-flow.
- Cap rate 5.8% vs local median 2.5% in Washington — top-decile yield for the area; either an underpriced asset or a hidden risk that comps aren't pricing in. Stress-test before assuming the spread holds.
Location & tenants
- Location reads 73/100 on livability (#1 in DC) — a middle-class / working-renter tenant base. Strengths: amenities A+, commute A+, employment A+; Watch: crime F, cost of living F.
- District Of Columbia Public Schools (urban): math 33% / reading 40% proficiency, ranked #8 of 32 in DC (top 25%) — families likely to look elsewhere, expect single-tenant / working-renter base with shorter leases; 65% free/reduced lunch — lower-income household profile, screen leases tightly.
- Market conditions: Rents rising (+4.0%/yr); 145 active listings in the ZIP; 40 comparable units currently listed for rent nearby; rentals at typical pace (median 24d on market — plan ~3-4 weeks tenant-placement turnaround); 1,737 units permitted in District of Columbia in 2024 (1,506 in 5+ unit buildings).
- This rent runs 36% of the median local income ($49k/yr) — at the standard rent-burdened threshold; future hikes will face affordability resistance.
Forward outlook
- Local home prices are declining (-3.0%/yr); year-one equity from $871 of loan paydown is wiped out by about $4k of value loss. Plan a longer hold.
- District of Columbia County population projected at +50% by 2050 — long-run rental-demand tailwind backs the buy-and-hold thesis.
Negotiation context
- Only 1 days on market — expect competitive offers; lowballing is unlikely to land.
- 5 sale attempts since 19y ago; this cycle's ask is 9980% above the opening price — seller raised mid-cycle; expect resistance to lowballs.
Risks & watch-outs
- Watch-outs: HOA is 29% of rent; built in 1953 — expect roof / HVAC / electrical / plumbing capex.
- Climate carrying-cost: extreme-heat days projected 7→16/yr by 2055 (HVAC capex compounding) — expect insurance premiums to compound above CPI over the hold.
Questions for the listing agent
- What do current leases actually rent for vs. the listed asking? Can we see a recent rent roll and the last 12 months of T-12 income?
- Built in 1953 — when were the roof, HVAC, electrical panel, plumbing, and water heater last replaced?
- What does the HOA fee cover, when was the last increase, and are there any pending special assessments or reserve-fund shortfalls?
- Any open or pending special assessments — roof, HVAC, plumbing, elevator, façade? What's the per-unit balance and payoff schedule, and is the seller paying it off at close or rolling it to the buyer?
- Is there a deadline driving the sale (1031 exchange, divorce, estate, relocation)? That informs how much negotiation room exists.
- Crime grade is F in this area — have there been break-ins, vandalism, or insurance claims at this property in the last 3 years? What carrier currently insures it and at what premium?
- The area grade is low — what's the realistic commute time and amenity access for the typical tenant pool here? Any planned neighborhood developments (good or bad) we should know about?
- What's the average days-on-market for RENTAL listings here right now (not sales)? A rising rental-DOM trend means longer vacancies and softer asking-rent achievability than the comps imply.
- What's the recent tenant-quality profile in this submarket — average credit score on applications, eviction rate, late-payment / NSF rate, and stable-employment percentage? A property-management company in the area should have these aggregated.
- How much new apartment / multifamily construction is in the pipeline within 1–3 miles? Heavy new supply (>2% of stock underway) typically softens rents 12–24 months out; light construction supports rent growth.
Investment metrics
- 1% rule
- 1.18% ✓
- Cap rate
- 5.79%
- Cash-on-cash
- -1.79%
- DSCR
- 0.92
- GRM
- 7.1
CMA / ARV
No comps found within radius.
Projected returns pro-forma
-3.0% appreciation · 3.96% rent growth · sell at horizon
- IRR
- -17.5%
- Equity multiple
- 0.37×
- Total profit
- $-22,082
- Equity at exit
- $18,787
- IRR
- -6.9%
- Equity multiple
- 0.53×
- Total profit
- $-16,495
- Equity at exit
- $10,894
Cash invested: $35,280 (down + closing). Projections, not guarantees.
Landlord ↔ Tenant lean methodology
- Overall (CITY)
- 0 Strongly Tenant-Friendly
- State District of Columbia
- 12 Strongly Tenant-Friendly · D+43
- County
- — inherits STATE
- City Washington
- 0 Strongly Tenant-Friendly · D+43
ZIP-level market 20032
- Home prices YoY
- -15.6%
- Rents YoY
- 4.0%
- Active inventory
- 145
- Price-to-rent
- 7.1×
Monthly cashflow live
- Estimated rent
- $1,489 high interval (Pro) →
- Mortgage (P&I)
- −$661
- Tax from tax record
- −$80 /mo · $954/yr
- Insurance
- −$52
- HOA
- −$436
- Vacancy / Maint / Mgmt
- −$313
- Net cashflow
- $-53
Break-even live
UW: 25.0% down · 7.5% · 30yr · 1.5% tax · 5.0% vac · 8.0% maint · 8.0% mgmt
Financing live
Cash to close
- Down payment
- $31,500
- Closing costs
- $3,780
- Reserves months
- —
- Total cash needed
- —
Loan-product check · same deal, 3 products live
Conventional
25% down · 7.5% · 30yr
- Down + closing
- —
- Monthly P&I
- —
- Monthly cashflow
- —
- DSCR
- —
- Eligible?
- —
Personal DTI + credit; lowest rate.
DSCR
20% down · 8.5% · 30yr
- Down + closing
- —
- Monthly P&I
- —
- Monthly cashflow
- —
- DSCR
- —
- Eligible?
- —
No personal income docs; deal must DSCR.
Hard money
10% down · 12.0% · 12mo
- Down + closing
- —
- Monthly P&I
- —
- Monthly cashflow
- —
- DSCR
- —
- Eligible?
- —
Short-term bridge; refi at stabilization.
Rent comps 40 comps
| Address | Beds | Baths | Sqft | Rent | $/sqft | DOM | Units | Dist |
|---|---|---|---|---|---|---|---|---|
| 730 Brandywine St SE #104 Washington, DC | 2.0 | 1.0 | 683 | $1,350 | $1.98 | 24d | 1 | 0.02mi |
| 713 Brandywine St SE Washington, DC | 2.0 | 1.0 | 707 | $1,650 | $2.33 | 24d | 1 | 0.03mi |
| 742 Brandywine St SE Washington, DC | 1.0 | 1.0 | 599 | $1,095 | $1.83 | 3d | 1 | 0.04mi |
| 705 Brandywine St SE #303 Washington, DC | 2.0 | 1.0 | 655 | $1,550 | $2.37 | 3d | 1 | 0.05mi |
| 811 Barnaby St SE Washington, DC | 1.0 | 1.0 | 650 | $1,275 | $1.96 | 24d | 1 | 0.05mi |
| 811 Barnaby St SE Apt 101 Washington, DC | 2.0 | 1.0 | 750 | $1,449 | $1.93 | 24d | 1 | 0.05mi |
| 701 Brandywine St SE #201 Washington, DC | 2.0 | 1.0 | 706 | $1,400 | $1.98 | 18d | 1 | 0.06mi |
| 808 Chesapeake St SE Washington, DC | 2.0 | 1.0 | 700 | $1,700 | $2.43 | 24d | 1 | 0.09mi |
| 820 Southern Ave SE Washington, DC | 2.0–3.0 | 1.0–1.5 | 840 | $1,450 | $1.73 | 2d | 65 | 0.16mi |
| 852 Barnaby St SE Washington, DC | 2.0–3.0 | 1.0–1.5 | 761 | $1,400 | $1.84 | 15d | 10 | 0.25mi |
| 3868 9th St SE Washington, DC | 2.0 | 1.0 | 740 | $1,450 | $1.96 | 24d | 1 | 0.31mi |
| 310 Atlantic St SE Washington, DC | 1.0–2.0 | 1.0 | 754 | $1,875 | $2.49 | 3d | 2 | 0.36mi |
| 1311 Southview Dr Oxon Hill, MD | 2.0 | 1.0 | 628 | $1,754 | $2.79 | 1d | 64 | 0.52mi |
| 207 Mississippi Ave SE Washington, DC | 1.0–2.0 | 1.0–1.5 | 656 | $1,559 | $2.38 | 24d | 10 | 0.53mi |
| 4641 6th St SE Washington, DC | 1.0 | 1.0 | 650 | $1,275 | $1.96 | 24d | 1 | 0.57mi |
| 4632 Livingston Rd SE Washington, DC | 1.0–2.0 | 1.0 | 755 | $1,329 | $1.76 | 24d | 10 | 0.61mi |
| 21 Chesapeake St SE Washington, DC | 2.0 | 1.0 | 670 | $1,250 | $1.87 | 19d | 1 | 0.63mi |
| 3429 5th St SE #42 Washington, DC | 1.0 | 1.0 | 702 | $1,395 | $1.99 | 13d | 1 | 0.68mi |
| 2 Elmira St SE Washington, DC | 1.0 | 1.0 | 710 | $1,342 | $1.89 | 24d | 1 | 0.70mi |
| 3865 Halley Ter SE Washington, DC | 1.0 | 1.0 | 650 | $1,210 | $1.86 | 24d | 1 | 0.71mi |
| 4001 S Capitol St SW Washington, DC | 3.0 | 1.0–2.0 | 782 | $1,975 | $2.52 | 13d | 1 | 0.72mi |
| 1002 Kennebec St Oxon Hill, MD | 1.0–2.0 | 1.0–1.5 | 871 | $1,921 | $2.20 | 1d | 12 | 0.72mi |
| 3320 6th St SE Washington, DC | 2.0 | 1.0 | 690 | $1,398 | $2.03 | 2d | 25 | 0.72mi |
| 6 Galveston St SW #303 Washington, DC | 2.0 | 1.0 | 708 | $1,700 | $2.40 | 24d | 1 | 0.74mi |
| 4721 1st St SW #203 Washington, DC | 2.0 | 1.0 | 741 | $1,600 | $2.16 | 24d | 1 | 0.76mi |
| 4725 1st St SW #102 Washington, DC | 2.0 | 1.0 | 580 | $1,850 | $3.19 | 24d | 1 | 0.76mi |
| 3730 Martin Luther King Jr Ave SE Washington, DC | 2.0 | 1.0 | 475 | $1,295 | $2.73 | 1d | 2 | 0.78mi |
| 1120 Trenton Pl SE Washington, DC | 1.0–2.0 | 1.0 | 715 | $1,325 | $1.85 | 10d | 3 | 0.78mi |
| 4729 1st St SW #202 Washington, DC | 2.0 | 1.0 | 589 | $1,650 | $2.80 | 24d | 1 | 0.78mi |
| 61 Forrester St SW Unit 104 Washington, DC | 2.0 | 1.0 | 639 | $1,700 | $2.66 | 24d | 1 | 0.82mi |
| 19 Galveston Pl SW #202 Washington, DC | 1.0 | 1.0 | 700 | $1,400 | $2.00 | 24d | 1 | 0.82mi |
| 3320 11th Pl SE Washington, DC | 1.0 | 1.0 | 750 | $1,198 | $1.60 | 24d | 1 | 0.84mi |
| 57 Galveston St SW Washington, DC | 1.0–2.0 | 1.0 | 650 | $1,299 | $2.00 | 4d | 5 | 0.85mi |
| 118 Galveston St SW Washington, DC | 1.0–3.0 | 1.0–2.0 | 951 | $1,690 | $1.78 | 2d | 10 | 0.89mi |
| 3325 13th St SE Unit 10 Washington, DC | 2.0 | 1.0 | 750 | $1,750 | $2.33 | 24d | 1 | 0.91mi |
| 1300 Congress St SE Unit 10 Washington, DC | 2.0 | 1.0 | 625 | $1,799 | $2.88 | 21d | 1 | 0.91mi |
| 3321 13th St SE Unit 3 Washington, DC | 2.0 | 1.0 | 703 | $1,750 | $2.49 | 24d | 1 | 0.92mi |
| 1310 Congress St SE Washington, DC | 1.0 | 1.0 | 518 | $1,150 | $2.22 | 24d | 1 | 0.93mi |
| 1309 Congress St SE Washington, DC | 1.0–2.0 | 1.0 | 625 | $1,250 | $2.00 | 15d | 1 | 0.95mi |
| 4660 Martin Luther King Jr Ave SW Washington, DC | 1.0–2.0 | 1.0–2.0 | 827 | $1,699 | $2.05 | 2d | 11 | 0.97mi |
HOA detail condo
- Monthly dues
- $436 · $5,232/yr
- Likely covers
- trashgassnow removal
- Assessments
- None detected in remarks — confirm with the listing agent.
Listing history 3 events
-
2026-06-18status $126,000 Active 1 DOM
-
2026-06-17remarks 681-char remark
-
2026-06-17$126,000 Coming Soon 1 DOM
ⓘ Source: listings_history table (triggers on properties + properties_extension) + one-shot
backfill from property_details.listing_events for pre-trigger history.
Tax reassessment forecast DC · Partial reset (capped growth)
- Current annual tax
- $954 · $80/mo
- Projected year-2 tax
- $954 · $80/mo
- Expected delta
- $0/yr ($0/mo · 0.0%)
ⓘ Screening estimate from a state-policy table — verify with the county assessor before closing.
Climate risk First Street
- Flood 1/10 Low FEMA zone X (unshaded) · 0% chance over 30 yrs
- Wildfire 3/10 Moderate
- Heat 8/10 Severe 7 d/yr ≥104°F today · 16 d/yr by 30 yrs out
- Wind 4/10 Moderate 17% chance of damaging wind over 30 yrs
- Air quality 3/10 Moderate 2 unhealthy d/yr today · 3 by 30 yrs out
Nearby sold comps map
Loading sold comps map…
Walkable amenities ~0.75 mi
Loading nearby amenities…
Taxation est. · year 1
- Rental income
- $17,864
- − Mortgage interest
- −$7,058
- − Property taxes
- −$954
- − Insurance
- −$630
- − Repairs & maintenance
- −$1,429
- − Management
- −$1,429
- − HOA
- −$5,232
- − Depreciation
- −$3,665
- Taxable loss
- −$2,534
- Est. tax savings @ 24.0%
- +$608
- After-tax cash flow
- $-25/yr
For passive investors: Depreciation is non-cash, so a rental often shows a tax loss while cash-flowing — sheltering income. Rental losses are passive: they offset passive income freely, and up to $25,000/yr can offset ordinary (W-2) income if you actively participate and your MAGI is under $100k (phasing out to $0 by $150k); unused losses carry forward. On sale, claimed depreciation is recaptured at up to 25%, and gains may owe capital-gains tax (a 1031 exchange can defer both). Figures are a year-1 estimate at your 24.0% rate — not tax advice; consult a CPA.
Schools (NCES district)
- District
- District Of Columbia Public Schools
- NCES district ID
- 1100030
- Math proficiency
- 33% ▲ 3.00%
- Reading proficiency
- 40% ▲ 5.00%
- Median HH income
- $67,671
- Composite
- 35.84/100
- National rank
- #9606
- State rank
- #8 of 32 in DC
Livability — Washington
- Score
- 73/100
- State rank
- #1
- US rank
- #5327
Category grades
Schools grade is shown separately in the Schools card above.
Census & demographics
- Census place
- Washington, DC
- County
- District of Columbia · 671,873 people
- City population
- 671,873
- Metro
- Washington-Arlington-Alexandria, DC-VA-MD-WV
- Population (ZIP)
- 40,920
- Household income
- $49,139
- Rent vs Own
- Severe rent burden
- 4530.0
Population outlook (District of Columbia County) Hauer SSP2
- Today (2025)
- 821,926 people
- By 2030
- 899,517 · +9.4%
- By 2040
- 1,061,162 · +29.1%
- By 2050
- 1,231,493 · +49.8%
- By 2075
- 1,603,312 · +95.1%
- By 2100
- 1,847,141 · +124.7%
Race, ethnicity, and origin ACS 2023
- Neighborhood character
- Predominantly Black (80%)
- Race & ethnicity
- Black 80% White 8% Two or more races 7% Hispanic / Latino 5%
- Foreign-born
- 4% · Canada
- Languages at home
- 95% English-only · Spanish 3%
Political lean MEDSL · District of Columbia
- 2024 margin
- Solid D (+86.1) · D 91.2% · R 5.1% · Other 3.8%
- 2008→2024 swing
- +0.1pp no change · 2008: 85.9pp · 2024: 86.1pp
- All cycles
- 2024: D+86.1 2020: D+86.8 2016: D+88.7 2012: D+84.2 2008: D+85.9
Not yet ingested
- Civics
- —
Market trends
- HPI YoY
- ▼ -60.34%
- Current HPI
- 326.4077
- Rent YoY
- ▲ 3.96%
- Metro
- Washington-Arlington-Alexandria, DC-VA-MD-WV
- State GDP YoY
- ▲ 1.33%
- F500 in state
- 6
Industry mix (Fortune 500 HQ in DC)
| Industry | F500 HQs | Revenue |
|---|---|---|
| Financial Services | 1 | $153B |
|
||
| Life Sciences / Industrials | 1 | $25B |
|
||
| Industrial Machinery | 1 | $8B |
|
||
Price history
-28.6% since first listed15 events — show timeline
- 2026-06-16 Coming Soon $126,000 BRIGHT MLS
- 2025-08-12 Rental Removed $1,250 BRIGHTMLS
- 2025-06-20 Listed for Rent $1,250 BRIGHTMLS
- 2024-05-22 Rental Removed $1,350 BRIGHTMLS
- 2024-02-13 Listed for Rent $1,400 BRIGHTMLS
- 2023-03-28 Sold (Public Records) $131,000 Public Records
- 2023-03-24 Sold (MLS) $131,000 BRIGHT MLS
- 2023-02-24 Contingent — BRIGHT MLS
- 2023-02-09 Listed $139,000 BRIGHT MLS
- 2021-09-21 Listing Removed — BRIGHT MLS
- 2021-08-29 Price Changed $158,000 BRIGHT MLS
- 2021-06-30 Listed $165,000 BRIGHT MLS
- 2007-03-20 Sold (MLS) $176,500 MRIS
- 2007-01-26 Delisted — MRIS
- 2007-01-18 Listed $176,500 MRIS
Property tax history
+1.2%/yrLatest (2025): $954 · -10.0% YoY. Source: county tax records.
Cash-flow waterfall
monthlySold comps — $/sqft
last 12 mo · ≤1 miLoading sold comps…