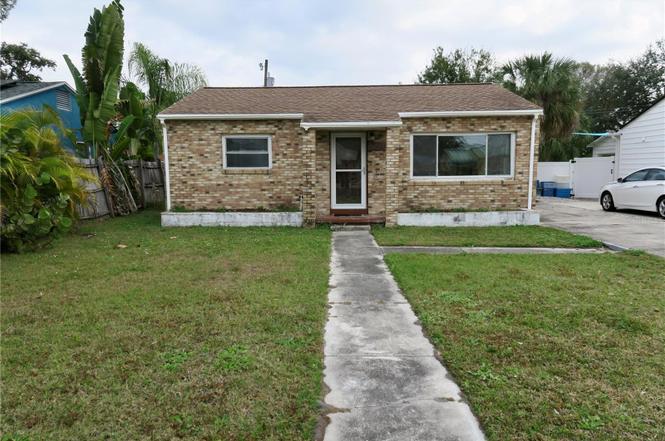
2654 Miriam St S
Gulfport, FL 33711
$238,999C-
3 bd · 1.0 ba ·
1,376 sqft ·
Built 1951
· SingleFamily
· Active
· 156 DOM
Cashflow @ list (25.0% down · 7.5%)
Estimated rent
$2,648/mo
Mortgage (P&I)
−$1,253
Tax + insurance
−$937
HOA
−$0
Vac / Maint / Mgmt
−$556
Net cashflow
$-99/mo
Annual
$-1,184/yr
Cap rate
7.94%
Cash-on-cash
5.88%
DSCR
1.26
1% rule
1.11%
Cash to close
$66,920
Investor read
- This is a 3-bed/1.0-bath single-family listed at $239k.
- At list price, monthly cash flow is $-99 ($-1k/yr) — negative.
- To cash-flow at today's rent, offer at most $222k (7.3% below list).
- Meets the 1% rule at list price ($3k rent vs $239k).
- It's been on market 156 days — a 12% lower offer ($210k) is reasonable based on typical stale-listing flexibility.
- Recommended offer: $210k (12.0% below list) — sets the bar for market timing.
- Local home prices are declining (-3.0%/yr); year-one equity from $2k of loan paydown is wiped out by about $7k of value loss. Plan a longer hold.
- Location reads 79/100 on livability (#151 in FL, #2,285 nationally) — a middle-class / working-renter tenant base. Strengths: commute A+, housing A+, health & safety A+; Watch: crime C-, schools D, amenities D.
- Pinellas (suburban): math 51% / reading 51% proficiency, ranked #31 of 73 in FL (top 42%) — acceptable for families but not a draw, mixed tenant base, ~2y average lease.
- Watch-outs: flood insurance adds $427/mo; built in 1951 — expect roof / HVAC / electrical / plumbing capex.
- Market conditions: Rents soft (-1.5%/yr); 261 active listings in the ZIP; 40 comparable units currently listed for rent nearby; rentals leasing fast (median 12d on market — plan ~1-2 weeks tenant-placement turnaround); 2,676 units permitted in Pinellas County in 2024 (1,422 in 5+ unit buildings).
- Pinellas County population projected at +14% by 2050 — modest demand growth; plan on rents tracking national, not racing it.
- Current owner paid $34k; list at $239k implies a 613% gain — meaningful room to come down on a strong offer.
- Climate carrying-cost: in FEMA flood zone AE (mandatory federal flood insurance); severe wind risk, 99% chance of damaging wind over 30y; extreme-heat days projected 7→26/yr by 2055 (HVAC capex compounding) — expect insurance premiums to compound above CPI over the hold.
- Cap rate 7.9% vs local median 2.0% in Gulfport — top-decile yield for the area; either an underpriced asset or a hidden risk that comps aren't pricing in. Stress-test before assuming the spread holds.
- At $2,648/mo this rent would consume 48% of the median local household income ($67k/yr) (locally 903% of renters already pay >50% of income on rent) — very limited rent-growth headroom before tenants either downsize or default.
Questions for listing agent
- What do current leases actually rent for vs. the listed asking? Can we see a recent rent roll and the last 12 months of T-12 income?
- It's been on market 156 days. Have you received any prior offers? Is the seller open to a 12% concession, seller financing, or rate buy-down credit?
- Built in 1951 — when were the roof, HVAC, electrical panel, plumbing, and water heater last replaced?
- What's the actual annual flood-insurance premium (NFIP or private), and is the property in a SFHA with mandatory coverage?
- Why hasn't it sold? Are there any deal-killer items the seller is aware of (foundation, flood, title, zoning, code violations)?
- Is there a deadline driving the sale (1031 exchange, divorce, estate, relocation)? That informs how much negotiation room exists.
- Schools are D-rated, which usually means shorter tenancies and higher turnover. Who's the typical renter profile here, and what's been the actual vacancy rate?
- What's the average days-on-market for RENTAL listings here right now (not sales)? A rising rental-DOM trend means longer vacancies and softer asking-rent achievability than the comps imply.
CashFlowRE · CFR-TPDYQDB5JGM1DM
· Data 2 days ago
cashflowre.app · 2026-05-29