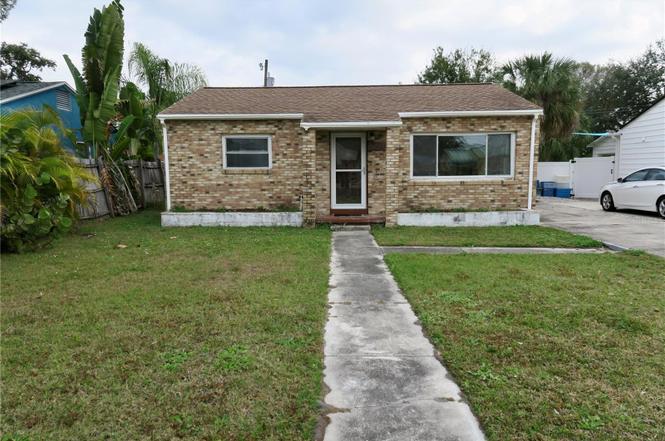
2654 Miriam St S · Gulfport, FL
Flood risk 9/10 · Severe
- FEMA flood zone
- AE
- Chance of flooding over 30 yrs
- 0.99%
- Est. flood insurance / yr
- $1,737 – $8,500
Fire risk 1/10 · Minimal
- Est. fire insurance / yr
- $947 – $1,759
Heat risk 10/10 · Severe
- Hot days now (above 106°F)
- 7 days/yr
- Hot days in 30 yrs
- 26 days/yr
Wind risk 10/10 · Severe
- Chance of severe wind over 30 yrs
- 99.0%
Air-quality risk 3/10 · Minor
- Unhealthy air days now
- 3 days/yr
- Unhealthy air days in 30 yrs
- 3 days/yr
Risk factors via First Street. Map © Google.
Why this score? — see what drove the C- grade
The composite is a weighted blend of 9 inputs, each scored 0–100. Each bar is that input's sub-score; the figure is the points it added to the 100-point composite (weight × sub-score).
- Cash flow +20.8/30.0
- ARV discount +7.5/15.0
- DSCR +6.6/10.0
- 1% rule +6.1/10.0
- Schools +4.3/10.0
- Livability +4.0/5.0
- Condition / age +2.5/5.0
- Rent growth +2.1/5.0
- Appreciation +0.0/10.0
$238,999
🖨 Deal sheet 📄 Offer letter ✓ Due diligence
Listing remarks
A great opportunity in the highly desirable Marina District of Gulfport! This home is being sold as-is and requires compliance with current floodplain regulations. The home offers a blank slate for investors, builders, or buyers looking to rebuild to their vision. Prime location just minutes from the marina, waterfront, downtown Gulfport, dining, shopping, and arts district. Buyer to verify all zoning, flood, and building requirements.
Key facts
- Arts district
- Shopping
- Marina district
Tags
Property features AI
Finance
- Other: Total living area reported as 1,376 sq ft; total building area 1,484 sq ft; Lot about 0.11 acre (approximately 465 m²)
- Financial info: Lease restrictions apply
- HOA & community: No HOA
Exterior
- Parking: No parking details provided
- Security: No security features listed
- Utilities: Public sewer (connected/available); No water source listed
- Home design: Single-family residence; One level; Facing west
- Construction: Brick construction; Shingle roof; Slab foundation; Built as a fixer property
- Exterior features: Asphalt road access
Interior
- Kitchen: No appliances listed
- Bedrooms: 3 bedrooms
- Flooring: Other flooring
- Bathrooms: 1 full bathroom
- Heating & cooling: Central heating; Central air conditioning
- Interior features: No notable interior features listed
- Laundry & utility: Laundry located inside
Neighborhood map
What this means for you Summary
Snapshot
- This is a 3-bed/1.0-bath single-family listed at $239k.
Deal economics
- At list price, monthly cash flow is $-99 ($-1k/yr) — negative.
- To cash-flow at today's rent, offer at most $222k (7.3% below list).
- Meets the 1% rule at list price ($3k rent vs $239k).
- Recommended offer: $210k (12.0% below list) — sets the bar for market timing.
- Cap rate 7.9% vs local median 2.0% in Gulfport — top-decile yield for the area; either an underpriced asset or a hidden risk that comps aren't pricing in. Stress-test before assuming the spread holds.
Location & tenants
- Location reads 79/100 on livability (#151 in FL, #2,285 nationally) — a middle-class / working-renter tenant base. Strengths: commute A+, housing A+, health & safety A+; Watch: crime C-, schools D, amenities D.
- Pinellas (suburban): math 51% / reading 51% proficiency, ranked #31 of 73 in FL (top 42%) — acceptable for families but not a draw, mixed tenant base, ~2y average lease.
- Market conditions: Rents soft (-1.5%/yr); 261 active listings in the ZIP; 40 comparable units currently listed for rent nearby; rentals leasing fast (median 11d on market — plan ~1-2 weeks tenant-placement turnaround); 2,676 units permitted in Pinellas County in 2024 (1,422 in 5+ unit buildings).
- At $2,648/mo this rent would consume 48% of the median local household income ($67k/yr) (locally 903% of renters already pay >50% of income on rent) — very limited rent-growth headroom before tenants either downsize or default.
Forward outlook
- Local home prices are declining (-3.0%/yr); year-one equity from $2k of loan paydown is wiped out by about $7k of value loss. Plan a longer hold.
- Pinellas County population projected at +14% by 2050 — modest demand growth; plan on rents tracking national, not racing it.
Negotiation context
- It's been on market 156 days — a 12% lower offer ($210k) is reasonable based on typical stale-listing flexibility.
- Current owner paid $34k; list at $239k implies a 613% gain — meaningful room to come down on a strong offer.
Risks & watch-outs
- Watch-outs: flood insurance adds $427/mo; built in 1951 — expect roof / HVAC / electrical / plumbing capex.
- Climate carrying-cost: in FEMA flood zone AE (mandatory federal flood insurance); severe wind risk, 99% chance of damaging wind over 30y; extreme-heat days projected 7→26/yr by 2055 (HVAC capex compounding) — expect insurance premiums to compound above CPI over the hold.
Questions for the listing agent
- What do current leases actually rent for vs. the listed asking? Can we see a recent rent roll and the last 12 months of T-12 income?
- It's been on market 156 days. Have you received any prior offers? Is the seller open to a 12% concession, seller financing, or rate buy-down credit?
- Built in 1951 — when were the roof, HVAC, electrical panel, plumbing, and water heater last replaced?
- What's the actual annual flood-insurance premium (NFIP or private), and is the property in a SFHA with mandatory coverage?
- Why hasn't it sold? Are there any deal-killer items the seller is aware of (foundation, flood, title, zoning, code violations)?
- Is there a deadline driving the sale (1031 exchange, divorce, estate, relocation)? That informs how much negotiation room exists.
- Schools are D-rated, which usually means shorter tenancies and higher turnover. Who's the typical renter profile here, and what's been the actual vacancy rate?
- What's the average days-on-market for RENTAL listings here right now (not sales)? A rising rental-DOM trend means longer vacancies and softer asking-rent achievability than the comps imply.
- What's the recent tenant-quality profile in this submarket — average credit score on applications, eviction rate, late-payment / NSF rate, and stable-employment percentage? A property-management company in the area should have these aggregated.
- How much new for-sale + rental construction is in the pipeline within 1–3 miles? Heavy new supply typically softens prices + rents 12–24 months out; constrained supply supports both.
Investment metrics
- 1% rule
- 1.11% ✓
- Cap rate
- 7.94%
- Cash-on-cash
- 5.88%
- DSCR
- 1.26
- GRM
- 7.5
CMA / ARV
- ARV (on-the-fly)
- $485,728
- Comps found
- 12
Show comp detail 12 sales within ~0.75 mi
| Address | Dist | Beds/Ba | Sqft | Sold | Price | $/sf | Match |
|---|---|---|---|---|---|---|---|
| 2648 46th St S | 0.05mi | 3/2.0 | 1,374 (-0%) | 1mo | $485,000 | $353 | 93 |
| 4624 27th Ave S | 0.13mi | 2/2.0 (-1) | 1,336 (-3%) | 1mo | $485,000 | $363 | 79 |
| 4658 25th Ave S | 0.19mi | 3/2.0 | 1,287 (-6%) | 0mo | $375,000 | $291 | 76 |
| 2409 50th St S | 0.45mi | 3/2.0 | 1,344 (-2%) | 7mo | $510,000 | $379 | 65 |
| 5029 29th Ave S | 0.47mi | 3/2.0 | 1,438 (+4%) | 6mo | $512,500 | $356 | 62 |
| 2301 46th St S | 0.29mi | 3/2.0 | 1,530 (+11%) | 8mo | $415,000 | $271 | 58 |
| 2507 49th St S | 0.36mi | 3/1.0 | 1,170 (-15%) | 8mo | $360,000 | $308 | 51 |
| 5240 31st Ave S | 0.72mi | 3/2.0 | 1,430 (+4%) | 11mo | $1,423,000 | $995 | 47 |
| 4649 Queensboro Ave S | 0.69mi | 3/2.0 | 1,479 (+8%) | 8mo | $459,900 | $311 | 45 |
| 5224 29th Ave S | 0.64mi | 3/1.0 | 1,172 (-15%) | 5mo | $255,000 | $218 | 41 |
| 5226 30th Ave S | 0.66mi | 3/2.0 | 1,536 (+12%) | 7mo | $585,000 | $381 | 40 |
| 1705 44th St S | 0.72mi | 4/2.0 (+1) | 1,578 (+15%) | 1mo | $330,000 | $209 | 32 |
Match score weights: distance 35% · size 25% · config 20% · recency 20%. Top-matched comps best support the ARV.
Projected returns pro-forma
-3.0% appreciation · 0.0% rent growth · sell at horizon
- IRR
- -23.7%
- Equity multiple
- 0.22×
- Total profit
- $-52,399
- Equity at exit
- $35,636
- IRR
- -36.3%
- Equity multiple
- -0.23×
- Total profit
- $-82,199
- Equity at exit
- $20,664
Cash invested: $66,920 (down + closing). Projections, not guarantees.
Landlord ↔ Tenant lean methodology
- Overall (STATE)
- 87 Strongly Landlord-Friendly
- State Florida
- 87 Strongly Landlord-Friendly · R+3
- County
- — inherits STATE
- City
- — inherits STATE
ZIP-level market 33711
- Rents YoY
- -1.5%
- Active inventory
- 261
- Price-to-rent
- 7.5×
Monthly cashflow live
- Estimated rent
- $2,648 high interval (Pro) →
- Mortgage (P&I)
- −$1,253
- Tax from tax record
- −$411 /mo · $4,932/yr
- Insurance
- −$100
- Flood insurance flood zone
- −$427 /mo · $5,118/yr
- HOA
- −$0
- Vacancy / Maint / Mgmt
- −$556
- Net cashflow
- $-99
Break-even live
UW: 25.0% down · 7.5% · 30yr · 1.5% tax · 5.0% vac · 8.0% maint · 8.0% mgmt
Financing live
Cash to close
- Down payment
- $59,750
- Closing costs
- $7,170
- Reserves months
- —
- Total cash needed
- —
Loan-product check · same deal, 3 products live
Conventional
25% down · 7.5% · 30yr
- Down + closing
- —
- Monthly P&I
- —
- Monthly cashflow
- —
- DSCR
- —
- Eligible?
- —
Personal DTI + credit; lowest rate.
DSCR
20% down · 8.5% · 30yr
- Down + closing
- —
- Monthly P&I
- —
- Monthly cashflow
- —
- DSCR
- —
- Eligible?
- —
No personal income docs; deal must DSCR.
Hard money
10% down · 12.0% · 12mo
- Down + closing
- —
- Monthly P&I
- —
- Monthly cashflow
- —
- DSCR
- —
- Eligible?
- —
Short-term bridge; refi at stabilization.
Rent comps 40 comps
| Address | Beds | Baths | Sqft | Rent | $/sqft | DOM | Units | Dist |
|---|---|---|---|---|---|---|---|---|
| 2800 Tifton St S Gulfport, FL | 3.0 | 2.0 | 1472 | $3,500 | $2.38 | 24d | 1 | 0.09mi |
| 2800 47th St S Gulfport, FL | 2.0 | 1.0 | 890 | $2,300 | $2.58 | 4d | 1 | 0.14mi |
| 4616 22nd Ave S Saint Petersburg, FL | 2.0 | 1.0 | 1200 | $2,400 | $2.00 | 24d | 1 | 0.35mi |
| 4601 22nd Ave S Saint Petersburg, FL | 1.0–2.0 | 1.0 | 872 | $1,349 | $1.55 | 2d | 3 | 0.39mi |
| 2044 44th St S Saint Petersburg, FL | 3.0 | 2.0 | 1384 | $2,600 | $1.88 | 22d | 1 | 0.46mi |
| 2865 51st St S Gulfport, FL | 2.0 | 1.0 | 944 | $1,900 | $2.01 | 12d | 1 | 0.47mi |
| 2865 51st St S Unit 5 Gulfport, FL | 2.0 | 1.0 | 944 | $1,900 | $2.01 | 14d | 1 | 0.48mi |
| 4618 20th Ave S Saint Petersburg, FL | 2.0 | 1.0 | 921 | $1,800 | $1.95 | 3d | 1 | 0.48mi |
| 2402 52nd St S Gulfport, FL | 2.0 | 2.0 | 1028 | $3,000 | $2.92 | 4d | 1 | 0.58mi |
| 3595 41st Ln S Unit B Saint Petersburg, FL | 2.0 | 2.0 | 1100 | $2,550 | $2.32 | 24d | 1 | 0.61mi |
| 3585 41st Way S Unit 46E St. Petersburg, FL | 3.0 | 2.0 | 1000 | $2,550 | $2.55 | 4d | 1 | 0.62mi |
| 3640 41st Ln S Unit F Saint Petersburg, FL | 2.0 | 2.0 | 1150 | $2,150 | $1.87 | 4d | 1 | 0.62mi |
| 2510 38th St S Saint Petersburg, FL | 3.0 | 1.5 | 1104 | $2,340 | $2.12 | 24d | 1 | 0.63mi |
| 2510 38th St S Saint Petersburg, FL | 3.0 | 1.5 | 1104 | $2,340 | $2.12 | 4d | 1 | 0.63mi |
| 4631 Queensboro Ave S St Petersburg, FL | 3.0 | 2.0 | 1094 | $2,600 | $2.38 | 11d | 1 | 0.70mi |
| 4631 Queensboro Ave S Unit 4631 St. Petersburg, FL | 3.0 | 2.0 | 1094 | $2,600 | $2.38 | 8d | 1 | 0.70mi |
| 2506 54th St S Gulfport, FL | 2.0 | 1.0 | 876 | $1,800 | $2.05 | 8d | 1 | 0.71mi |
| 2506 54th St S Gulfport, FL | 2.0 | 1.0 | 938 | $1,800 | $1.92 | 24d | 1 | 0.71mi |
| 3775 40th Ln S Unit L Saint Petersburg, FL | 3.0 | 2.0 | 1375 | $2,500 | $1.82 | 24d | 1 | 0.73mi |
| 3280 37th Way S Unit B Saint Petersburg, FL | 2.0 | 2.0 | 1100 | $1,700 | $1.55 | 24d | 1 | 0.76mi |
| 5105 Tangerine Ave S Gulfport, FL | 4.0 | 2.0 | 1860 | $3,750 | $2.02 | 4d | 1 | 0.77mi |
| 3627 29th Ave S Saint Petersburg, FL | 2.0 | 1.0 | 1040 | $2,000 | $1.92 | 8d | 1 | 0.78mi |
| 3901 38th Ave S Saint Petersburg, FL | 1.0–3.0 | 1.0–2.5 | 1070 | $1,675 | $1.57 | 2d | 9 | 0.78mi |
| 4327 17th Ave S Saint Petersburg, FL | 2.0 | 1.0 | 880 | $2,500 | $2.84 | 24d | 1 | 0.78mi |
| 1628 43rd St S Saint Petersburg, FL | 3.0 | 2.0 | 1045 | $2,100 | $2.01 | 24d | 1 | 0.82mi |
| 1543 43rd St S Saint Petersburg, FL | 4.0 | 2.0 | 1198 | $3,495 | $2.92 | 4d | 1 | 0.84mi |
| 1734 39th St S Saint Petersburg, FL | 4.0 | 2.0 | 1152 | $2,000 | $1.74 | 24d | 1 | 0.90mi |
| 1642 39th St S Saint Petersburg, FL | 3.0 | 1.0 | 975 | $1,995 | $2.05 | 20d | 1 | 0.94mi |
| 1327 43rd St S Saint Petersburg, FL | 3.0 | 1.5 | 959 | $2,250 | $2.35 | 4d | 1 | 0.97mi |
| 1701 53rd St S Gulfport, FL | 3.0 | 1.0 | 994 | $2,800 | $2.82 | 4d | 1 | 0.97mi |
| 5702 27th Ave S Gulfport, FL | 3.0 | 2.0 | 1407 | $3,300 | $2.35 | 24d | 1 | 0.97mi |
| 5708 27th Ave S Gulfport, FL | 2.0 | 1.0 | 1407 | $3,000 | $2.13 | 4d | 1 | 0.98mi |
| 4718 13th Ave S Saint Petersburg, FL | 4.0 | 1.5 | 1520 | $2,881 | $1.90 | 13d | 1 | 0.98mi |
| 2626 58th St S Gulfport, FL | 2.0 | 1.0 | 900 | $2,050 | $2.28 | 4d | 1 | 1.03mi |
| 5618 20th Ave S Gulfport, FL | 3.0 | 2.0 | 1289 | $3,000 | $2.33 | 24d | 1 | 1.04mi |
| 3038 58th St S Gulfport, FL | 2.0 | 2.0 | 1098 | $2,600 | $2.37 | 4d | 1 | 1.05mi |
| 3301 32nd Ave S Saint Petersburg, FL | 1.0–2.0 | 1.0–2.0 | 914 | $2,750 | $3.01 | 3d | 10 | 1.08mi |
| 4029 13th Ave S St Petersburg, FL | 3.0 | 2.0 | 1152 | $2,650 | $2.30 | 24d | 1 | 1.08mi |
| 4933 13th Ave S Gulfport, FL | 2.0 | 1.0 | 939 | $2,200 | $2.34 | 20d | 1 | 1.09mi |
| 3603 16th Ave S Saint Petersburg, FL | 4.0 | 2.0 | 1235 | $3,000 | $2.43 | 4d | 1 | 1.12mi |
Listing history 18 events
-
2026-06-18days on market $238,999 Active 156 DOM
-
2026-06-17days on market $238,999 Active 155 DOM
-
2026-06-16pricedays on market $238,999 Active 154 DOM
-
2026-06-15days on market $244,999 Active 153 DOM
-
2026-06-13days on market $244,999 Active 151 DOM
-
2026-06-09days on market $244,999 Active 147 DOM
-
2026-06-08days on market $244,999 Active 146 DOM
-
2026-06-07days on market $244,999 Active 145 DOM
-
2026-06-04days on market $244,999 Active 142 DOM
-
2026-06-03days on market $244,999 Active 141 DOM
-
2026-06-01days on market $244,999 Active 139 DOM
-
2026-05-31days on market $244,999 Active 138 DOM
-
2026-05-19price $244,999
-
2026-03-04price $249,999
-
2026-01-13$265,000 Active
-
1991-10-15soldstatus $33,500
-
1991-10-15soldstatus $41,000
-
1985-10-01soldstatus $34,100
ⓘ Source: listings_history table (triggers on properties + properties_extension) + one-shot
backfill from property_details.listing_events for pre-trigger history.
Tax reassessment forecast FL · Resets to sale price
- Current annual tax
- $4,932 · $411/mo
- Projected year-2 tax
- $4,932 · $411/mo
- Expected delta
- $0/yr ($0/mo · 0.0%)
ⓘ Screening estimate from a state-policy table — verify with the county assessor before closing.
Climate risk First Street
- Flood 9/10 Extreme FEMA zone AE · 99% chance over 30 yrs
- Wildfire 1/10 Low
- Heat 10/10 Extreme 7 d/yr ≥106°F today · 26 d/yr by 30 yrs out
- Wind 10/10 Extreme 99% chance of damaging wind over 30 yrs
- Air quality 3/10 Moderate 3 unhealthy d/yr today · 3 by 30 yrs out
Nearby sold comps map
Loading sold comps map…
Walkable amenities ~0.75 mi
Loading nearby amenities…
Taxation est. · year 1
- Rental income
- $31,775
- − Mortgage interest
- −$13,388
- − Property taxes
- −$4,932
- − Insurance
- −$6,313
- − Repairs & maintenance
- −$2,542
- − Management
- −$2,542
- − Depreciation
- −$6,953
- Taxable loss
- −$4,895
- Est. tax savings @ 24.0%
- +$1,175
- After-tax cash flow
- $-9/yr
For passive investors: Depreciation is non-cash, so a rental often shows a tax loss while cash-flowing — sheltering income. Rental losses are passive: they offset passive income freely, and up to $25,000/yr can offset ordinary (W-2) income if you actively participate and your MAGI is under $100k (phasing out to $0 by $150k); unused losses carry forward. On sale, claimed depreciation is recaptured at up to 25%, and gains may owe capital-gains tax (a 1031 exchange can defer both). Figures are a year-1 estimate at your 24.0% rate — not tax advice; consult a CPA.
Schools (NCES district)
- District
- Pinellas
- NCES district ID
- 1201560
- Math proficiency
- 51% ▼ -5.00%
- Reading proficiency
- 51% ▼ -3.00%
- Median HH income
- $46,270
- Composite
- 43.27/100
- National rank
- #3046
- State rank
- #31 of 73 in FL
Livability — Gulfport
- Score
- 79/100
- State rank
- #151
- US rank
- #2285
Category grades
Schools grade is shown separately in the Schools card above.
Census & demographics
- Census place
- Gulfport, FL
- County
- Pinellas County · 939,478 people
- City population
- 24,324
- Metro
- Tampa-St. Petersburg-Clearwater, FL
- Population (ZIP)
- 20,013
- Household income
- $66,540
- Rent vs Own
- Severe rent burden
- 903.0
Population outlook (Pinellas County) Hauer SSP2
- Today (2025)
- 1,027,532 people
- By 2030
- 1,063,586 · +3.5%
- By 2040
- 1,125,020 · +9.5%
- By 2050
- 1,168,637 · +13.7%
- By 2075
- 1,265,188 · +23.1%
- By 2100
- 1,260,357 · +22.7%
Race, ethnicity, and origin ACS 2023
- Neighborhood character
- Diverse neighborhood (Simpson 0.59)
- Race & ethnicity
- White 45% Black 45% Hispanic / Latino 6% Two or more races 6%
- Hispanic origin (detail)
- Puerto Rican 1%
- Common ancestry
- Romanian 2% Lithuanian 2% Italian 1%
- Foreign-born
- 7% · Canada, Dominican Republic
- Languages at home
- 91% English-only · Spanish 4% French/Haitian/Cajun 3% Other Indo-European 1%
Political lean MEDSL · Pinellas
- 2024 margin
- Lean R (+5.2) · D 46.9% · R 52.1%
- 2008→2024 swing
- -13.5pp toward R · 2008: 8.3pp · 2024: -5.2pp
- All cycles
- 2024: R+5.2 2020: D+0.2 2016: R+1.1 2012: D+5.6 2008: D+8.3
Not yet ingested
- Civics
- —
Market trends
- HPI YoY
- ▼ -313.54%
- Current HPI
- 338.2712
- Rent YoY
- ▼ -1.47%
- Metro
- Tampa-St. Petersburg-Clearwater, FL
- State GDP YoY
- ▲ 3.28%
- F500 in state
- 36
Industry mix (Fortune 500 HQ in FL)
| Industry | F500 HQs | Revenue |
|---|---|---|
| Industrial Technology | 2 | $29B |
|
||
| Insurance | 2 | $17B |
|
||
| Retail | 1 | $60B |
|
||
| Technology Distribution | 1 | $58B |
|
||
| Homebuilding | 1 | $35B |
|
||
| Technology Manufacturing | 1 | $35B |
|
||
Price history
+618.5% since first listed6 events — show timeline
- 2026-05-19 Price Changed $244,999 Stellar MLS as Distributed by MLS Grid
- 2026-03-04 Price Changed $249,999 Stellar MLS as Distributed by MLS Grid
- 2026-01-13 Listed $265,000 Stellar MLS as Distributed by MLS Grid
- 1991-10-15 Sold (Public Records) $41,000 Public Records
- 1991-10-15 Sold (Public Records) $33,500 Public Records
- 1985-10-01 Sold (Public Records) $34,100 Public Records
Property tax history
+7.5%/yrLatest (2025): $4,932 · +1.3% YoY. Source: county tax records.
Cash-flow waterfall
monthlySold comps — $/sqft
last 12 mo · ≤1 miLoading sold comps…