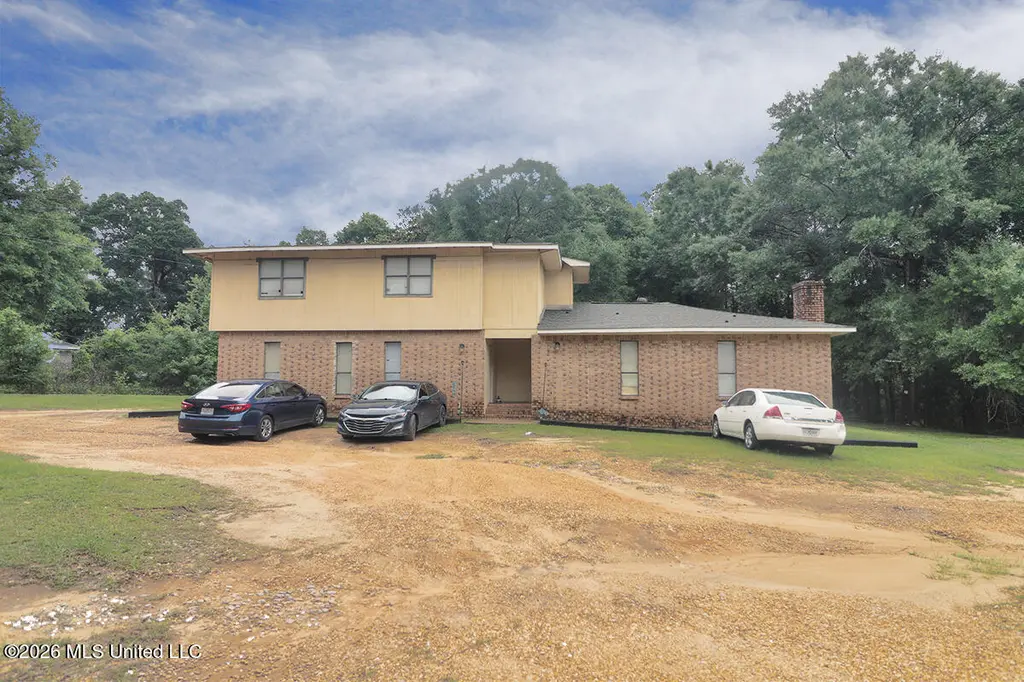
46 L Mcdonald Rd
Wiggins, MS 39577
$159,900B-
9 bd · 9.0 ba ·
3,200 sqft ·
Built 1980
· MultiFamily
· Active
· 16 DOM
Cashflow @ list (25.0% down · 7.5%)
Estimated rent
$4,160/mo
Mortgage (P&I)
−$839
Tax + insurance
−$266
HOA
−$0
Vac / Maint / Mgmt
−$874
Net cashflow
$2,181/mo
Annual
$26,176/yr
Cap rate
22.66%
Cash-on-cash
58.47%
DSCR
3.60
1% rule
2.60%
Cash to close
$44,772
Investor read
- This is a 3 × 3-bed/3.0-bath units multifamily listed at $160k. Condition is rated fair.
- At list price, monthly cash flow is $2k ($26k/yr) — positive. Per door: $727/mo.
- The deal already cash-flows at list — no discount required.
- Meets the 1% rule at list price ($4k rent vs $160k).
- It's been on market 16 days — a 2% lower offer ($158k) is reasonable based on typical stale-listing flexibility.
- Recommended offer: $158k (1.5% below list) — sets the bar for market timing.
- Local home prices are declining (-3.0%/yr); year-one equity from $1k of loan paydown is wiped out by about $5k of value loss. Plan a longer hold.
- Location reads 68/100 on livability (#58 in MS) — a middle-class / working-renter tenant base. Strengths: cost of living A+, health & safety A+, housing B+; Watch: schools C-, crime D, amenities F.
- Stone County School District (town): math 52% / reading 46% proficiency, ranked #15 of 130 in MS (top 12%) — families likely to look elsewhere, expect single-tenant / working-renter base with shorter leases.
- Market conditions: 70 active listings in the ZIP; 60 units permitted in Stone County in 2024 (0 in 5+ unit buildings).
- Stone County population projected to shrink 4% by 2050 — rents likely to lag national; underwrite the cash flow, not the appreciation.
- 5 sale attempts since 17y ago with the ask held roughly flat each time — persistent listings suggest the price (not the market) is what's stuck; bring a comps-based counter.
- At projected returns (-3.0% appreciation + 3.0% rent growth), your $45k cash investment doubles in ~2 years — after that, you're playing with house money.
- Climate carrying-cost: severe wind risk, 99% chance of damaging wind over 30y; major wildfire risk; extreme-heat days projected 7→20/yr by 2055 (HVAC capex compounding) — expect insurance premiums to compound above CPI over the hold.
- Cap rate 22.7% vs local median 4.5% in Wiggins — top-decile yield for the area; either an underpriced asset or a hidden risk that comps aren't pricing in. Stress-test before assuming the spread holds.
Questions for listing agent
- Can we see the unit-by-unit rent roll, current vacancy, and any below-market leases? What's the average tenancy length?
- What capital expenditures (roof, boiler, parking lot, exteriors) have been made in the last 5 years, and what's planned in the next 2?
- Have any recent inspections been done? Can we get a copy of the seller's disclosures and any deferred-maintenance estimates?
- Is there a deadline driving the sale (1031 exchange, divorce, estate, relocation)? That informs how much negotiation room exists.
- Crime grade is D in this area — have there been break-ins, vandalism, or insurance claims at this property in the last 3 years? What carrier currently insures it and at what premium?
- What's the average days-on-market for RENTAL listings here right now (not sales)? A rising rental-DOM trend means longer vacancies and softer asking-rent achievability than the comps imply.
- What's the recent tenant-quality profile in this submarket — average credit score on applications, eviction rate, late-payment / NSF rate, and stable-employment percentage? A property-management company in the area should have these aggregated.
- How much new apartment / multifamily construction is in the pipeline within 1–3 miles? Heavy new supply (>2% of stock underway) typically softens rents 12–24 months out; light construction supports rent growth.
Repairs flagged (vision-AI assessment)
- Moderate: kitchen cabinets — dated and in need of replacement
- Moderate: bathroom fixtures — dated and in need of replacement
- Minor: paint — peeling in some areas
CashFlowRE · CFR-TPZACR450JFPAZ
· Data 2 days ago
cashflowre.app · 2026-05-29