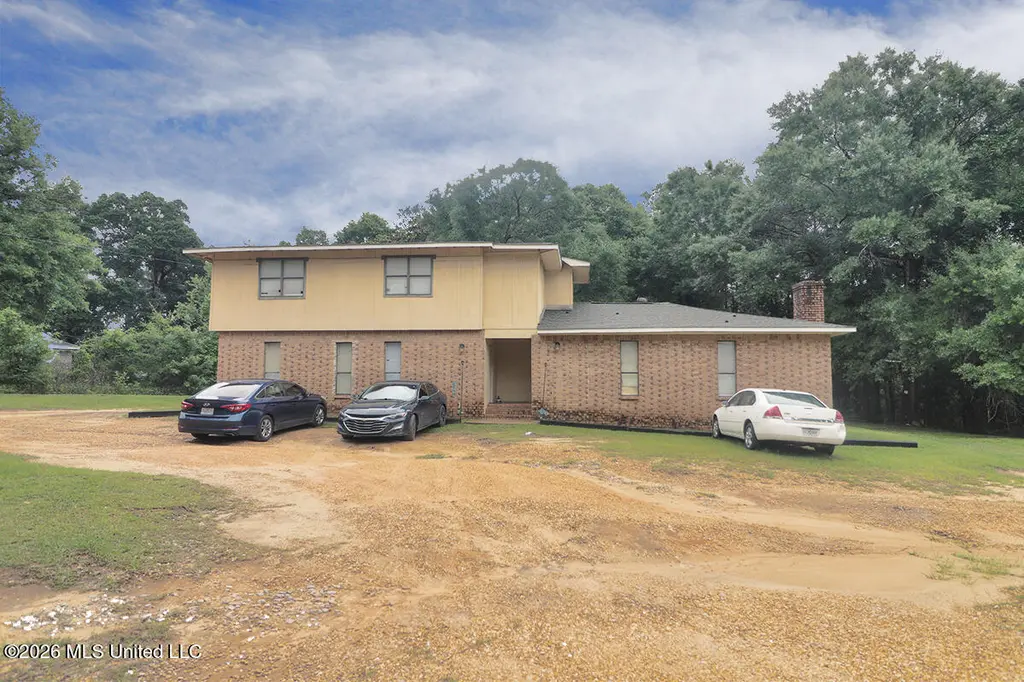
 Triplex
46 L Mcdonald Rd · Wiggins, MS
Flood risk 1/10 · Minimal
- FEMA flood zone
- X (unshaded)
- Chance of flooding over 30 yrs
- 0.0%
- Est. flood insurance / yr
- $507 – $1,088
Fire risk 7/10 · Major
- Est. fire insurance / yr
- $1,241 – $2,305
Heat risk 8/10 · Major
- Hot days now (above 107°F)
- 7 days/yr
- Hot days in 30 yrs
- 20 days/yr
Wind risk 9/10 · Severe
- Chance of severe wind over 30 yrs
- 99.0%
Air-quality risk 1/10 · Minimal
- Unhealthy air days now
- 0 days/yr
- Unhealthy air days in 30 yrs
- 0 days/yr
Risk factors via First Street. Map © Google.
Why this score? — see what drove the B- grade
The composite is a weighted blend of 9 inputs, each scored 0–100. Each bar is that input's sub-score; the figure is the points it added to the 100-point composite (weight × sub-score).
- Cash flow +30.0/30.0
- 1% rule +10.0/10.0
- DSCR +10.0/10.0
- ARV discount +7.5/15.0
- Schools +4.1/10.0
- Livability +3.4/5.0
- Rent growth +2.5/5.0
- Condition / age +2.2/5.0
- Appreciation +0.0/10.0
$159,900
🖨 Deal sheet 📄 Offer letter ✓ Due diligence
Multi-family units
County records classify this as Multi-Family (2-4 Unit). Listing-text estimate: 3 units. confirmed
Listing remarks MLS
REDUCED TO SELL!! LESS THAN $25.00/sqft!! Triplex. Keep as rentals, live in part w/separate in-law qtrs or convert to lg home on 1 ac. Appl stay/sep. meters. Easy to Hattiesburg & Coast. At this price Seller pays only Sales Commission & pro rated tax. Sold ''AS IS''
Key facts
- 1 acre lot
- Built 1980
- Listed 15 days
Property features AI
Finance
- Other: Lot size about 1.00 acre
- Financial info: Property is a 3-unit building
Exterior
- Parking: Driveway with unpaved/gravel surface
- Utilities: Public water; Public sewer; Electricity connected; Water connected; Sewer connected
- Home design: Triplex; Two levels; Total building area approximately 3,200 (per appraiser)
- Construction: Brick veneer and siding exterior; Slab foundation; Year built per public records
- Exterior features: Shingle roof; Rectangular lot; Lot dimensions approximately 249' x 170'
Interior
- Kitchen: Oven; Refrigerator
- Flooring: Luxury vinyl; Carpet; Laminate
- Bathrooms: 3 bathrooms
- Heating & cooling: Electric heating; Central air conditioning; Electric cooling
- Interior features: Oven; Refrigerator
Neighborhood map
What this means for you Summary
Snapshot
- This is a 3 × 3-bed/3.0-bath units multifamily listed at $160k. Condition is rated fair.
Deal economics
- At list price, monthly cash flow is $2k ($26k/yr) — positive. Per door: $727/mo.
- The deal already cash-flows at list — no discount required.
- Meets the 1% rule at list price ($4k rent vs $160k).
- Recommended offer: $158k (1.5% below list) — sets the bar for market timing.
- Cap rate 22.7% vs local median 4.5% in Wiggins — top-decile yield for the area; either an underpriced asset or a hidden risk that comps aren't pricing in. Stress-test before assuming the spread holds.
Location & tenants
- Location reads 68/100 on livability (#58 in MS) — a middle-class / working-renter tenant base. Strengths: cost of living A+, health & safety A+, housing B+; Watch: schools C-, crime D, amenities F.
- Stone County School District (town): math 52% / reading 46% proficiency, ranked #15 of 130 in MS (top 12%) — families likely to look elsewhere, expect single-tenant / working-renter base with shorter leases.
- Market conditions: 70 active listings in the ZIP; 60 units permitted in Stone County in 2024 (0 in 5+ unit buildings).
Forward outlook
- Local home prices are declining (-3.0%/yr); year-one equity from $1k of loan paydown is wiped out by about $5k of value loss. Plan a longer hold.
- Stone County population projected to shrink 4% by 2050 — rents likely to lag national; underwrite the cash flow, not the appreciation.
- At projected returns (-3.0% appreciation + 3.0% rent growth), your $45k cash investment doubles in ~2 years — after that, you're playing with house money.
Negotiation context
- It's been on market 16 days — a 2% lower offer ($158k) is reasonable based on typical stale-listing flexibility.
- 5 sale attempts since 17y ago with the ask held roughly flat each time — persistent listings suggest the price (not the market) is what's stuck; bring a comps-based counter.
Risks & watch-outs
- Climate carrying-cost: severe wind risk, 99% chance of damaging wind over 30y; major wildfire risk; extreme-heat days projected 7→20/yr by 2055 (HVAC capex compounding) — expect insurance premiums to compound above CPI over the hold.
Questions for the listing agent
- Can we see the unit-by-unit rent roll, current vacancy, and any below-market leases? What's the average tenancy length?
- What capital expenditures (roof, boiler, parking lot, exteriors) have been made in the last 5 years, and what's planned in the next 2?
- Have any recent inspections been done? Can we get a copy of the seller's disclosures and any deferred-maintenance estimates?
- Is there a deadline driving the sale (1031 exchange, divorce, estate, relocation)? That informs how much negotiation room exists.
- Crime grade is D in this area — have there been break-ins, vandalism, or insurance claims at this property in the last 3 years? What carrier currently insures it and at what premium?
- What's the average days-on-market for RENTAL listings here right now (not sales)? A rising rental-DOM trend means longer vacancies and softer asking-rent achievability than the comps imply.
- What's the recent tenant-quality profile in this submarket — average credit score on applications, eviction rate, late-payment / NSF rate, and stable-employment percentage? A property-management company in the area should have these aggregated.
- How much new apartment / multifamily construction is in the pipeline within 1–3 miles? Heavy new supply (>2% of stock underway) typically softens rents 12–24 months out; light construction supports rent growth.
Investment metrics
- 1% rule
- 2.60% ✓
- Cap rate
- 22.66%
- Cash-on-cash
- 58.47%
- DSCR
- 3.60
- GRM
- 3.2
CMA / ARV
No comps found within radius.
Projected returns pro-forma
-3.0% appreciation · 3.0% rent growth · sell at horizon
- IRR
- 57.1%
- Equity multiple
- 3.53×
- Total profit
- $113,085
- Equity at exit
- $23,842
- IRR
- 62.0%
- Equity multiple
- 7.20×
- Total profit
- $277,625
- Equity at exit
- $13,825
Cash invested: $44,772 (down + closing). Projections, not guarantees.
Landlord ↔ Tenant lean methodology
- Overall (STATE)
- 90 Strongly Landlord-Friendly
- State Mississippi
- 90 Strongly Landlord-Friendly · R+11
- County
- — inherits STATE
- City
- — inherits STATE
ZIP-level market 39577
- Home prices YoY
- -30.1%
- Active inventory
- 70
- Price-to-rent
- 9.6×
Monthly cashflow live
- Estimated rent
- $4,160 medium interval (Pro) →
- Mortgage (P&I)
- −$839
- Tax est. 1.5%
- −$200 /mo · $2,398/yr
- Insurance
- −$67
- HOA
- −$0
- Vacancy / Maint / Mgmt
- −$874
- Net cashflow
- $2,181
Break-even live
3-unit breakdown (identical units grouped — click to expand)
| Units | Beds | Baths | Est. rent |
|---|---|---|---|
| 3× units | 3 | 3 | $4,161 |
| #1 | 3 | 3 | $1,387 |
| #2 | 3 | 3 | $1,387 |
| #3 | 3 | 3 | $1,387 |
| Total (3 units) | $4,160 | ||
UW: 25.0% down · 7.5% · 30yr · 1.5% tax · 5.0% vac · 8.0% maint · 8.0% mgmt
Financing live
Cash to close
- Down payment
- $39,975
- Closing costs
- $4,797
- Reserves months
- —
- Total cash needed
- —
Loan-product check · same deal, 3 products live
Conventional
25% down · 7.5% · 30yr
- Down + closing
- —
- Monthly P&I
- —
- Monthly cashflow
- —
- DSCR
- —
- Eligible?
- —
Personal DTI + credit; lowest rate.
DSCR
20% down · 8.5% · 30yr
- Down + closing
- —
- Monthly P&I
- —
- Monthly cashflow
- —
- DSCR
- —
- Eligible?
- —
No personal income docs; deal must DSCR.
Hard money
10% down · 12.0% · 12mo
- Down + closing
- —
- Monthly P&I
- —
- Monthly cashflow
- —
- DSCR
- —
- Eligible?
- —
Short-term bridge; refi at stabilization.
Listing history 14 events
-
2026-06-18days on market $159,900 Active 16 DOM
-
2026-06-17days on market $159,900 Active 15 DOM
-
2026-06-16days on market $159,900 Active 14 DOM
-
2026-06-16price $159,900 Active 13 DOM
-
2026-06-15days on market $165,000 Active 13 DOM
-
2026-06-13days on market $165,000 Active 11 DOM
-
2026-06-12days on market $165,000 Active 10 DOM
-
2026-06-09days on market $165,000 Active 7 DOM
-
2026-06-08days on market $165,000 Active 6 DOM
-
2026-06-07days on market $165,000 Active 5 DOM
-
2026-06-07remarks 518-char remark
-
2026-06-07days on market $165,000 Active 4 DOM
-
2026-06-03remarks 496-char remark
-
2026-06-03$165,000 Active 1 DOM
ⓘ Source: listings_history table (triggers on properties + properties_extension) + one-shot
backfill from property_details.listing_events for pre-trigger history.
Climate risk First Street
- Flood 1/10 Low FEMA zone X (unshaded) · 0% chance over 30 yrs
- Wildfire 7/10 Severe
- Heat 8/10 Severe 7 d/yr ≥107°F today · 20 d/yr by 30 yrs out
- Wind 9/10 Extreme 99% chance of damaging wind over 30 yrs
- Air quality 1/10 Low 0 unhealthy d/yr today · 0 by 30 yrs out
Nearby sold comps map
Loading sold comps map…
Walkable amenities ~0.75 mi
Loading nearby amenities…
Taxation est. · year 1
- Rental income
- $49,920
- − Mortgage interest
- −$8,957
- − Property taxes
- −$2,398
- − Insurance
- −$800
- − Repairs & maintenance
- −$3,994
- − Management
- −$3,994
- − Depreciation
- −$4,652
- Taxable income
- $25,126
- Est. tax owed @ 24.0%
- −$6,030
- After-tax cash flow
- $20,146/yr
For passive investors: Depreciation is non-cash, so a rental often shows a tax loss while cash-flowing — sheltering income. Rental losses are passive: they offset passive income freely, and up to $25,000/yr can offset ordinary (W-2) income if you actively participate and your MAGI is under $100k (phasing out to $0 by $150k); unused losses carry forward. On sale, claimed depreciation is recaptured at up to 25%, and gains may owe capital-gains tax (a 1031 exchange can defer both). Figures are a year-1 estimate at your 24.0% rate — not tax advice; consult a CPA.
Condition & rehab AI · 12 photos
This multi-family property requires moderate renovations to its kitchens and bathrooms, which would significantly increase its value for both resale and rental purposes.
Repairs flagged
- Moderate kitchen cabinets — dated and in need of replacement
- Moderate bathroom fixtures — dated and in need of replacement
- Minor paint — peeling in some areas
Value-add opportunities
- Both kitchen renovation — modernizing the kitchen would increase both resale and rental value
- Both bathroom updates — modernizing the bathrooms would increase both resale and rental value
- Rental landscaping — improved landscaping would enhance curb appeal and rental appeal
Renovation cost estimate screening
| Repair item | Severity | Est. cost |
|---|---|---|
| kitchen cabinets · dated and in need of replacement | Moderate | $3,000–15,000 |
| bathroom fixtures · dated and in need of replacement | Moderate | $3,000–15,000 |
| paint · peeling in some areas | Minor | $500–3,000 |
| Total estimated repair cost · 3 items | $6,500–33,000 |
Value-add ROI direction
- Both kitchen renovation — modernizing the kitchen would increase both resale and rental value ↑
- Both bathroom updates — modernizing the bathrooms would increase both resale and rental value ↑
- Rental landscaping — improved landscaping would enhance curb appeal and rental appeal ↑
ⓘ Cost ranges are severity-bucket heuristics (US national rule-of-thumb). Get contractor quotes + a written scope before underwriting a rehab budget.
Schools (NCES district)
- District
- Stone County School District
- NCES district ID
- 2804170
- Math proficiency
- 52% ▼ -8.00%
- Reading proficiency
- 46% ▼ -7.00%
- Median HH income
- $43,785
- Composite
- 41.4/100
- National rank
- #3476
- State rank
- #15 of 130 in MS
Livability — Wiggins
- Score
- 68/100
- State rank
- #58
- US rank
- #9290
Category grades
Schools grade is shown separately in the Schools card above.
Census & demographics
- Population (ZIP)
- 10,488
Population outlook (Stone County) Hauer SSP2
- Today (2025)
- 18,528 people
- By 2030
- 18,585 · +0.3%
- By 2040
- 18,429 · -0.5%
- By 2050
- 17,825 · -3.8%
- By 2075
- 16,095 · -13.1%
- By 2100
- 14,276 · -22.9%
Race, ethnicity, and origin ACS 2023
- Neighborhood character
- Predominantly White (67%)
- Race & ethnicity
- White 67% Black 27% Two or more races 4% Hispanic / Latino 3%
- Common ancestry
- Lithuanian 4% Serbian 1% Italian 1%
- Foreign-born
- 1% · Canada
- Languages at home
- 99% English-only · Spanish 1%
Political lean MEDSL · Stone
- 2024 margin
- Solid R (+58.0) · D 20.5% · R 78.5% · Other 1.1%
- 2008→2024 swing
- -14.5pp toward R · 2008: -43.5pp · 2024: -58.0pp
- All cycles
- 2024: R+58.0 2020: R+52.8 2016: R+53.5 2012: R+45.9 2008: R+43.5
Not yet ingested
- Civics
- —
Market trends
- HPI YoY
- ▼ -68.19%
- Current HPI
- 158.2419
- Rent YoY
- —
- Metro
- —
- State GDP YoY
- —
- F500 in state
- 0
Price history
+27.9% since first listed9 events — show timeline
- 2026-06-02 Listed $165,000 MLSU
- 2021-10-01 Listing Removed — MLSU
- 2016-11-17 Sold (MLS) — MLSU
- 2016-07-19 Listed $77,100 MLSU
- 2015-03-03 Listing Removed — MLSU
- 2014-12-19 Listed $75,100 MLSU
- 2014-09-08 Listing Removed — MLSU
- 2012-07-22 Listed $99,000 MLSU
- 2009-08-01 Listed $129,000 MLSU
Cash-flow waterfall
monthlySold comps — $/sqft
last 12 mo · ≤1 miLoading sold comps…