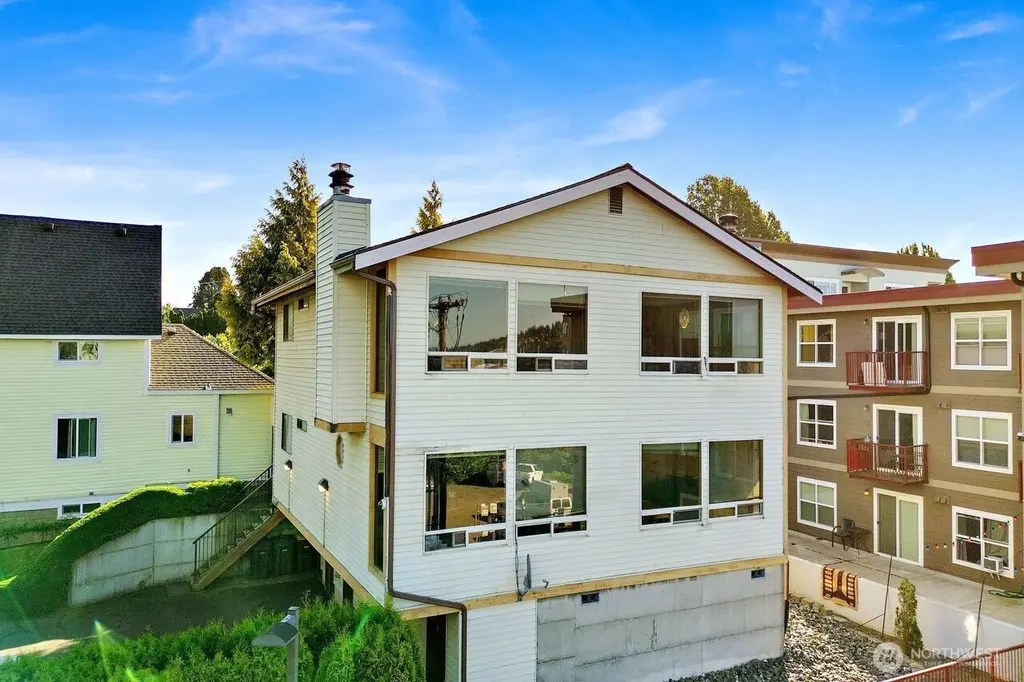
1408 G St
Bellingham, WA 98225
$965,000D-
1 bd · 1.0 ba ·
2,352 sqft ·
Built 1980
· MultiFamily
· Active
· 16 DOM
Cashflow @ list (25.0% down · 7.5%)
Estimated rent
$7,092/mo
Mortgage (P&I)
−$5,061
Tax + insurance
−$1,027
HOA
−$0
Vac / Maint / Mgmt
−$1,489
Net cashflow
$-485/mo
Annual
$-5,823/yr
Cap rate
5.69%
Cash-on-cash
-2.16%
DSCR
0.90
1% rule
0.73%
Cash to close
$270,200
Investor read
- This is a 4 × 1-bed/1-bath units multifamily listed at $965k.
- At list price, monthly cash flow is $-485 ($-6k/yr) — negative. Per door: $-121/mo.
- To cash-flow at today's rent, offer at most $879k (8.9% below list).
- To meet the 1% rule (rent ≥ 1% of price), the offer needs to be $709k (26.5% below list).
- It's been on market 16 days — a 2% lower offer ($951k) is reasonable based on typical stale-listing flexibility.
- Recommended offer: $709k (26.5% below list) — sets the bar for 1% rule.
- Local home prices are declining (-3.0%/yr); year-one equity from $7k of loan paydown is wiped out by about $29k of value loss. Plan a longer hold.
- Location reads 80/100 on livability (#102 in WA, #1,947 nationally) — a professional / high-income tenant draw. Strengths: amenities A+, commute A+, health & safety A+; Watch: crime F, cost of living F.
- Bellingham School District (urban): math 47% / reading 63% proficiency, ranked #106 of 291 in WA (top 36%) — acceptable for families but not a draw, mixed tenant base, ~2y average lease.
- Zoned schools: Parkview Elementary School (399 students, 34% FRL); Bellingham High School (1,218 students, 34% FRL) — zoned schools at 34% FRL track the district average.
- Market conditions: Rents rising (+2.7%/yr); 235 active listings in the ZIP; 1,190 units permitted in Whatcom County in 2024 (327 in 5+ unit buildings).
- Whatcom County population projected at +28% by 2050 — long-run rental-demand tailwind backs the buy-and-hold thesis.
- 2 sale attempts since 2y ago with the ask held roughly flat each time — persistent listings suggest the price (not the market) is what's stuck; bring a comps-based counter.
- Current owner paid $345k; list at $965k implies a 180% gain — meaningful room to come down on a strong offer.
- Cap rate 5.7% vs local median 2.0% in Bellingham — top-decile yield for the area; either an underpriced asset or a hidden risk that comps aren't pricing in. Stress-test before assuming the spread holds.
- At $7,092/mo this rent would consume 133% of the median local household income ($64k/yr) (locally 4351% of renters already pay >50% of income on rent) — very limited rent-growth headroom before tenants either downsize or default.
Questions for listing agent
- What do current leases actually rent for vs. the listed asking? Can we see a recent rent roll and the last 12 months of T-12 income?
- Can we see the unit-by-unit rent roll, current vacancy, and any below-market leases? What's the average tenancy length?
- What capital expenditures (roof, boiler, parking lot, exteriors) have been made in the last 5 years, and what's planned in the next 2?
- Is there a deadline driving the sale (1031 exchange, divorce, estate, relocation)? That informs how much negotiation room exists.
- Schools are B-rated — typically a magnet for longer-tenancy family renters. What's the average tenant stay here, and is there a school-zone premium baked into asking?
- Crime grade is F in this area — have there been break-ins, vandalism, or insurance claims at this property in the last 3 years? What carrier currently insures it and at what premium?
- The area grade is low — what's the realistic commute time and amenity access for the typical tenant pool here? Any planned neighborhood developments (good or bad) we should know about?
- What's the average days-on-market for RENTAL listings here right now (not sales)? A rising rental-DOM trend means longer vacancies and softer asking-rent achievability than the comps imply.
CashFlowRE · CFR-TPZHCT4P8YKYHD
· Data 2 days ago
cashflowre.app · 2026-05-29