 Fourplex
1408 G St · Bellingham, WA
Flood risk 1/10 · Minimal
- FEMA flood zone
- X (unshaded)
- Chance of flooding over 30 yrs
- 0.0%
- Est. flood insurance / yr
- $507 – $1,088
Fire risk 1/10 · Minimal
- Est. fire insurance / yr
- $604 – $1,122
Heat risk 3/10 · Minor
- Hot days now (above 84°F)
- 7 days/yr
- Hot days in 30 yrs
- 18 days/yr
Wind risk 1/10 · Minimal
- Chance of severe wind over 30 yrs
- —
Air-quality risk 6/10 · Moderate
- Unhealthy air days now
- 9 days/yr
- Unhealthy air days in 30 yrs
- 9 days/yr
Risk factors via First Street. Map © Google.
Why this score? — see what drove the D- grade
The composite is a weighted blend of 9 inputs, each scored 0–100. Each bar is that input's sub-score; the figure is the points it added to the 100-point composite (weight × sub-score).
- Cash flow +10.6/30.0
- ARV discount +7.5/15.0
- Schools +4.8/10.0
- Livability +4.0/5.0
- Rent growth +3.2/5.0
- DSCR +3.0/10.0
- Condition / age +2.5/5.0
- 1% rule +2.3/10.0
- Appreciation +0.0/10.0
$965,000
🖨 Deal sheet 📄 Offer letter ✓ Due diligence
Multi-family units
County records classify this as Multi-Family (2-4 Unit). Listing-text estimate: 4 units. confirmed
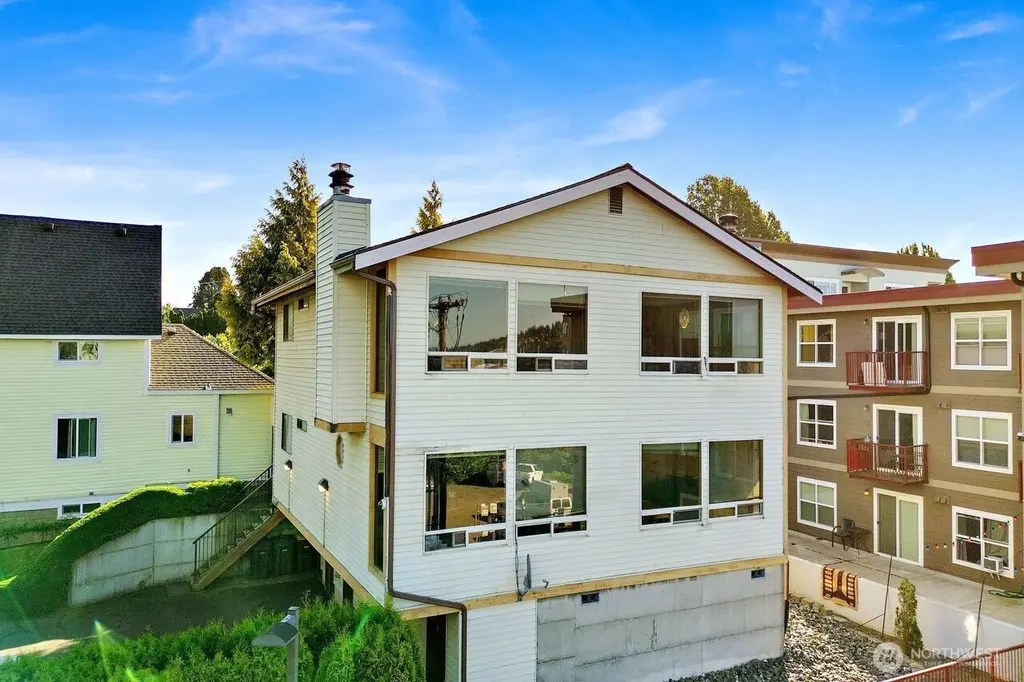
Listing remarks
Exceptional investment opportunity located in Bellingham's waterfront Old Town District and the highly sought-after Lettered Streets neighborhood. This well-maintained fourplex features four 1-bedroom, 1-bath units, each offering views of Bellingham Bay. Ideally situated near downtown Bellingham, Western Washington University, the waterfront, shopping, dining, parks, and public transportation, this property benefits from strong rental demand and a highly convenient location. Features include a newer roof, a dedicated on-site parking lot with ample off-street parking, a community laundry room for tenant convenience, and a dedicated storage locker for each unit. Consistent occupancy and poten
Key facts
- Strong rental demand
- Bay views
- Waterfront location
Tags
Property features AI
Finance
- Other: Calculated building area 2,352 square feet; Site features include high-speed internet; Zoned for city jurisdiction
- Financial info: Gross scheduled income approximately $65,400 per year; Gross adjusted income $65,400 per year; Total monthly income $5,450; Net operating income $37,994; Total annual expenses $27,406; Electric annual expense $741; Insurance annual expense $2,243; Other annual expenses $12,507; Gross rent multiplier 14.75; Acceptable financing: Cash, Conventional, VA Loan
Exterior
- Parking: Seven uncovered parking spaces
- Utilities: Electric energy source; Public water (City of Bellingham); Sewer connected (PSE); Electric service by PSE; Cable connected (Xfinity); Internet connected (Xfinity)
- Home design: Residential income property (quadruplex); 2-story building; Very good condition
- Construction: Built in 1980 (effective year); Metal/vinyl and wood construction; Composition roof; Poured concrete foundation
- Exterior features: Metal/vinyl and wood exterior materials; Paved lot; Has a view
Interior
- Kitchen: Each unit includes a range/oven; Each unit includes a refrigerator; Each unit includes a dishwasher
- Bedrooms: Four 1-bedroom units (each unit listed as 1 bedroom)
- Flooring: Vinyl flooring; Carpet flooring
- Bathrooms: Four 1-bath units (each unit has 1 bathroom)
- Heating & cooling: Baseboard heating; No cooling system
- Interior features: Vinyl and carpet flooring; Baseboard heating; No central air; Each unit has a fireplace; High-speed internet available
- Laundry & utility: No in-unit washer/dryer (washer/dryer not provided in units)
Neighborhood map
What this means for you Summary
Snapshot
- This is a 4 × 1-bed/1-bath units multifamily listed at $965k.
Deal economics
- At list price, monthly cash flow is $-485 ($-6k/yr) — negative. Per door: $-121/mo.
- To cash-flow at today's rent, offer at most $879k (8.9% below list).
- To meet the 1% rule (rent ≥ 1% of price), the offer needs to be $709k (26.5% below list).
- Recommended offer: $709k (26.5% below list) — sets the bar for 1% rule.
- Cap rate 5.7% vs local median 2.0% in Bellingham — top-decile yield for the area; either an underpriced asset or a hidden risk that comps aren't pricing in. Stress-test before assuming the spread holds.
Location & tenants
- Location reads 80/100 on livability (#102 in WA, #1,947 nationally) — a professional / high-income tenant draw. Strengths: amenities A+, commute A+, health & safety A+; Watch: crime F, cost of living F.
- Bellingham School District (urban): math 47% / reading 63% proficiency, ranked #106 of 291 in WA (top 36%) — acceptable for families but not a draw, mixed tenant base, ~2y average lease.
- Zoned schools: Parkview Elementary School (399 students, 34% FRL); Bellingham High School (1,218 students, 34% FRL) — zoned schools at 34% FRL track the district average.
- Market conditions: Rents rising (+2.7%/yr); 235 active listings in the ZIP; 1,190 units permitted in Whatcom County in 2024 (327 in 5+ unit buildings).
- At $7,092/mo this rent would consume 133% of the median local household income ($64k/yr) (locally 4351% of renters already pay >50% of income on rent) — very limited rent-growth headroom before tenants either downsize or default.
Forward outlook
- Local home prices are declining (-3.0%/yr); year-one equity from $7k of loan paydown is wiped out by about $29k of value loss. Plan a longer hold.
- Whatcom County population projected at +28% by 2050 — long-run rental-demand tailwind backs the buy-and-hold thesis.
Negotiation context
- It's been on market 16 days — a 2% lower offer ($951k) is reasonable based on typical stale-listing flexibility.
- 2 sale attempts since 2y ago with the ask held roughly flat each time — persistent listings suggest the price (not the market) is what's stuck; bring a comps-based counter.
- Current owner paid $345k; list at $965k implies a 180% gain — meaningful room to come down on a strong offer.
Questions for the listing agent
- What do current leases actually rent for vs. the listed asking? Can we see a recent rent roll and the last 12 months of T-12 income?
- Can we see the unit-by-unit rent roll, current vacancy, and any below-market leases? What's the average tenancy length?
- What capital expenditures (roof, boiler, parking lot, exteriors) have been made in the last 5 years, and what's planned in the next 2?
- Is there a deadline driving the sale (1031 exchange, divorce, estate, relocation)? That informs how much negotiation room exists.
- Schools are B-rated — typically a magnet for longer-tenancy family renters. What's the average tenant stay here, and is there a school-zone premium baked into asking?
- Crime grade is F in this area — have there been break-ins, vandalism, or insurance claims at this property in the last 3 years? What carrier currently insures it and at what premium?
- The area grade is low — what's the realistic commute time and amenity access for the typical tenant pool here? Any planned neighborhood developments (good or bad) we should know about?
- What's the average days-on-market for RENTAL listings here right now (not sales)? A rising rental-DOM trend means longer vacancies and softer asking-rent achievability than the comps imply.
- What's the recent tenant-quality profile in this submarket — average credit score on applications, eviction rate, late-payment / NSF rate, and stable-employment percentage? A property-management company in the area should have these aggregated.
- How much new apartment / multifamily construction is in the pipeline within 1–3 miles? Heavy new supply (>2% of stock underway) typically softens rents 12–24 months out; light construction supports rent growth.
Investment metrics
- 1% rule
- 0.73% ✗
- Cap rate
- 5.69%
- Cash-on-cash
- -2.16%
- DSCR
- 0.90
- GRM
- 11.3
CMA / ARV
No comps found within radius.
Projected returns pro-forma
-3.0% appreciation · 2.67% rent growth · sell at horizon
- IRR
- -20.2%
- Equity multiple
- 0.30×
- Total profit
- $-189,877
- Equity at exit
- $143,885
- IRR
- -14.0%
- Equity multiple
- 0.20×
- Total profit
- $-215,724
- Equity at exit
- $83,436
Cash invested: $270,200 (down + closing). Projections, not guarantees.
Landlord ↔ Tenant lean methodology
- Overall (STATE)
- 28 Tenant-Leaning
- State Washington
- 28 Tenant-Leaning · D+8
- County
- — inherits STATE
- City
- — inherits STATE
ZIP-level market 98225
- Rents YoY
- 2.7%
- Active inventory
- 235
- Price-to-rent
- 45.4×
Monthly cashflow live
- Estimated rent
- $7,092 high interval (Pro) →
- Mortgage (P&I)
- −$5,061
- Tax from tax record
- −$625 /mo · $7,504/yr
- Insurance
- −$402
- HOA
- −$0
- Vacancy / Maint / Mgmt
- −$1,489
- Net cashflow
- $-485
Break-even live
4-unit breakdown (identical units grouped — click to expand)
| Units | Beds | Baths | Est. rent |
|---|---|---|---|
| 4× units | 1 | 1 | $7,092 |
| #1 | 1 | 1 | $1,773 |
| #2 | 1 | 1 | $1,773 |
| #3 | 1 | 1 | $1,773 |
| #4 | 1 | 1 | $1,773 |
| Total (4 units) | $7,092 | ||
UW: 25.0% down · 7.5% · 30yr · 1.5% tax · 5.0% vac · 8.0% maint · 8.0% mgmt
Financing live
Cash to close
- Down payment
- $241,250
- Closing costs
- $28,950
- Reserves months
- —
- Total cash needed
- —
Loan-product check · same deal, 3 products live
Conventional
25% down · 7.5% · 30yr
- Down + closing
- —
- Monthly P&I
- —
- Monthly cashflow
- —
- DSCR
- —
- Eligible?
- —
Personal DTI + credit; lowest rate.
DSCR
20% down · 8.5% · 30yr
- Down + closing
- —
- Monthly P&I
- —
- Monthly cashflow
- —
- DSCR
- —
- Eligible?
- —
No personal income docs; deal must DSCR.
Hard money
10% down · 12.0% · 12mo
- Down + closing
- —
- Monthly P&I
- —
- Monthly cashflow
- —
- DSCR
- —
- Eligible?
- —
Short-term bridge; refi at stabilization.
Listing history 13 events
-
2026-06-18days on market $965,000 Active 16 DOM
-
2026-06-17days on market $965,000 Active 15 DOM
-
2026-06-16days on market $965,000 Active 14 DOM
-
2026-06-15days on market $965,000 Active 13 DOM
-
2026-06-14days on market $965,000 Active 11 DOM
-
2026-06-13days on market $965,000 Active 10 DOM
-
2026-06-10days on market $965,000 Active 8 DOM
-
2026-06-09days on market $965,000 Active 7 DOM
-
2026-06-08days on market $965,000 Active 6 DOM
-
2026-06-07days on market $965,000 Active 5 DOM
-
2026-06-05days on market $965,000 Active 2 DOM
-
2026-06-03remarks 699-char remark
-
2026-06-03$965,000 Active 1 DOM
ⓘ Source: listings_history table (triggers on properties + properties_extension) + one-shot
backfill from property_details.listing_events for pre-trigger history.
Tax reassessment forecast WA · Resets to sale price
- Current annual tax
- $7,504 · $625/mo
- Projected year-2 tax
- $9,457 · $788/mo
- Expected delta
- +$1,953/yr (+$163/mo · 26.0%)
ⓘ Screening estimate from a state-policy table — verify with the county assessor before closing.
Climate risk First Street
- Flood 1/10 Low FEMA zone X (unshaded) · 0% chance over 30 yrs
- Wildfire 1/10 Low
- Heat 3/10 Moderate 7 d/yr ≥84°F today · 18 d/yr by 30 yrs out
- Wind 1/10 Low
- Air quality 6/10 Major 9 unhealthy d/yr today · 9 by 30 yrs out
Nearby sold comps map
Loading sold comps map…
Walkable amenities ~0.75 mi
Loading nearby amenities…
Taxation est. · year 1
- Rental income
- $85,104
- − Mortgage interest
- −$54,055
- − Property taxes
- −$7,504
- − Insurance
- −$4,825
- − Repairs & maintenance
- −$6,808
- − Management
- −$6,808
- − Depreciation
- −$28,073
- Taxable loss
- −$22,969
- Est. tax savings @ 24.0%
- +$5,513
- After-tax cash flow
- $-311/yr
For passive investors: Depreciation is non-cash, so a rental often shows a tax loss while cash-flowing — sheltering income. Rental losses are passive: they offset passive income freely, and up to $25,000/yr can offset ordinary (W-2) income if you actively participate and your MAGI is under $100k (phasing out to $0 by $150k); unused losses carry forward. On sale, claimed depreciation is recaptured at up to 25%, and gains may owe capital-gains tax (a 1031 exchange can defer both). Figures are a year-1 estimate at your 24.0% rate — not tax advice; consult a CPA.
Schools (NCES district)
- District
- Bellingham School District
- NCES district ID
- 5300420
- Math proficiency
- 47% ▼ -6.00%
- Reading proficiency
- 63% ▼ -1.00%
- Median HH income
- $47,678
- Composite
- 48.49/100
- National rank
- #4632
- State rank
- #106 of 291 in WA
Livability — Bellingham
- Score
- 80/100
- State rank
- #102
- US rank
- #1947
Category grades
Schools grade is shown separately in the Schools card above.
Census & demographics
- Census place
- Bellingham, WA
- County
- Whatcom County · 209,776 people
- City population
- 130,296
- Metro
- Bellingham, WA
- Population (ZIP)
- 50,216
- Household income
- $63,941
- Rent vs Own
- Severe rent burden
- 4351.0
Population outlook (Whatcom County) Hauer SSP2
- Today (2025)
- 240,408 people
- By 2030
- 254,667 · +5.9%
- By 2040
- 281,365 · +17.0%
- By 2050
- 307,592 · +27.9%
- By 2075
- 375,576 · +56.2%
- By 2100
- 421,637 · +75.4%
Race, ethnicity, and origin ACS 2023
- Neighborhood character
- Predominantly White (78%)
- Race & ethnicity
- White 78% Hispanic / Latino 10% Two or more races 9% Asian 4% Black 1%
- Hispanic origin (detail)
- Mexican 5%
- Common ancestry
- Italian 5% Portuguese 5% Slovak 4%
- Foreign-born
- 7% · Canada, China, Vietnam
- Languages at home
- 89% English-only · Spanish 6% Chinese 1% Other Indo-European 1%
Political lean MEDSL · Whatcom
- 2024 margin
- Strong D (+24.9) · D 60.8% · R 35.9% · Other 3.3%
- 2008→2024 swing
- +6.9pp toward D · 2008: 18.0pp · 2024: 24.9pp
- All cycles
- 2024: D+24.9 2020: D+23.9 2016: D+17.7 2012: D+12.1 2008: D+18.0
Not yet ingested
- Civics
- —
Market trends
- HPI YoY
- ▼ -1126.32%
- Current HPI
- 463.2721
- Rent YoY
- ▲ 2.67%
- Metro
- Bellingham, WA
- State GDP YoY
- ▲ 4.65%
- F500 in state
- 22
Industry mix (Fortune 500 HQ in WA)
| Industry | F500 HQs | Revenue |
|---|---|---|
| Retail | 2 | $269B |
|
||
| Technology / Retail | 1 | $638B |
|
||
| Technology | 1 | $245B |
|
||
| Telecommunications | 1 | $38B |
|
||
| Food / Beverage | 1 | $36B |
|
||
| Automotive / Trucks | 1 | $34B |
|
||
Price history
+179.7% since first listed5 events — show timeline
- 2026-06-02 Listed $965,000 NWMLS as Distributed by MLS Grid
- 2024-05-30 Rental Removed $1,325 APPFOLIO
- 2024-05-17 Listed for Rent $1,325 APPFOLIO
- 2022-03-22 Price Changed $1,250 RENT.
- 2004-12-07 Sold (Public Records) $345,000 Public Records
Property tax history
+6.5%/yrLatest (2026): $7,504 · +4.5% YoY. Source: county tax records.
Cash-flow waterfall
monthlySold comps — $/sqft
last 12 mo · ≤1 miLoading sold comps…