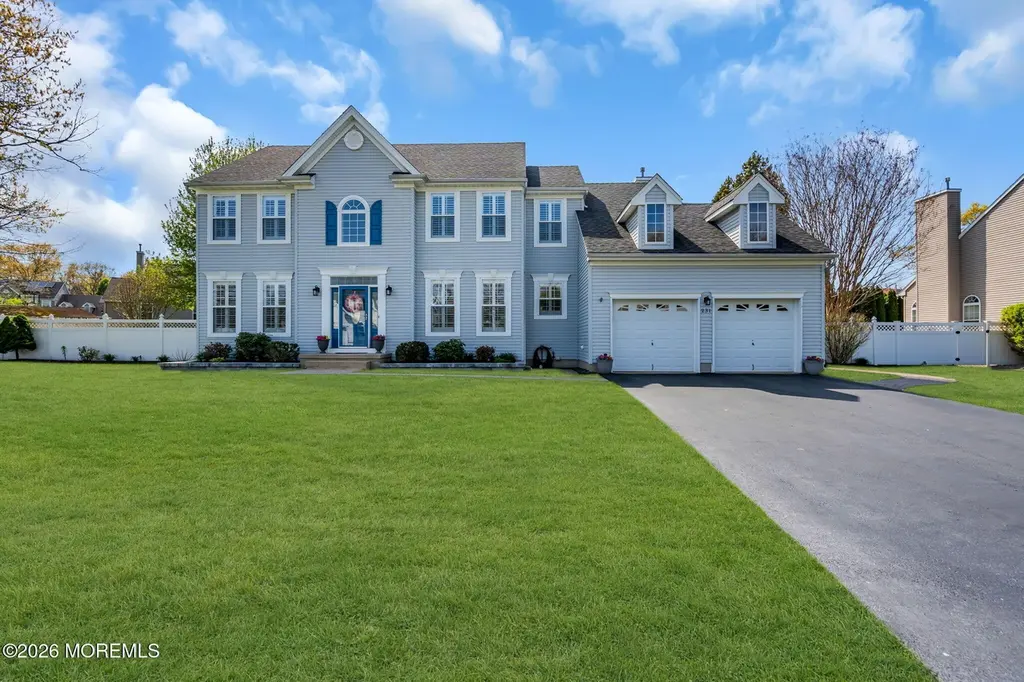
231 Eagleswood Ave
Forked River, NJ 08734
$779,000D+
4 bd · 3.0 ba ·
2,526 sqft ·
Built 2005
· SingleFamily
· Pending
· 7 DOM
Cashflow @ list (25.0% down · 7.5%)
Estimated rent
$8,139/mo
Mortgage (P&I)
−$4,085
Tax + insurance
−$1,321
HOA
−$0
Vac / Maint / Mgmt
−$1,709
Net cashflow
$1,024/mo
Annual
$12,291/yr
Cap rate
7.87%
Cash-on-cash
5.63%
DSCR
1.25
1% rule
1.04%
Cash to close
$218,120
Investor read
- This is a 4-bed/3.0-bath single-family listed at $779k.
- At list price, monthly cash flow is $1k ($12k/yr) — positive.
- The deal already cash-flows at list — no discount required.
- Meets the 1% rule at list price ($8k rent vs $779k).
- Only 7 days on market — expect competitive offers; lowballing is unlikely to land.
- Local home prices are declining (-3.0%/yr); year-one equity from $5k of loan paydown is wiped out by about $23k of value loss. Plan a longer hold.
- Location reads 61/100 on livability (#464 in NJ) — a middle-class / working-renter tenant base. Strengths: housing A+, crime A-, employment A-; Watch: amenities F, commute F, cost of living F.
- Lacey Township School District (suburban): math 22% / reading 43% proficiency, ranked #299 of 472 in NJ (top 63%) — families likely to look elsewhere, expect single-tenant / working-renter base with shorter leases; only 19% free/reduced lunch — higher-income household profile.
- Zoned schools: Lanoka Harbor Elementary School (math 32% / reading 42%, grade F, #528 of 1,303 statewide, top 43%, 443 students, 27% FRL); Mill Pond Elementary School (math 18% / reading 39%, grade F, #332 of 431 statewide, top 77%, 680 students, 27% FRL); Lacey Township High School (math 25% / reading 49%, grade F, #217 of 399 statewide, top 57%, 1,222 students, 24% FRL).
- Market conditions: 57 active listings in the ZIP; 2 comparable units currently listed for rent nearby; 4,434 units permitted in Ocean County in 2024 (868 in 5+ unit buildings).
- Ocean County population projected to shrink 8% by 2050 — rents likely to lag national; underwrite the cash flow, not the appreciation.
- 2 sale attempts with the ask held roughly flat each time — persistent listings suggest the price (not the market) is what's stuck; bring a comps-based counter.
- Climate carrying-cost: major wind risk, 75% chance of damaging wind over 30y; extreme-heat days projected 7→15/yr by 2055 (HVAC capex compounding) — expect insurance premiums to compound above CPI over the hold.
- Cap rate 7.9% vs local median 3.2% in Forked River — top-decile yield for the area; either an underpriced asset or a hidden risk that comps aren't pricing in. Stress-test before assuming the spread holds.
Questions for listing agent
- Is there a deadline driving the sale (1031 exchange, divorce, estate, relocation)? That informs how much negotiation room exists.
- The area grade is low — what's the realistic commute time and amenity access for the typical tenant pool here? Any planned neighborhood developments (good or bad) we should know about?
- What's the average days-on-market for RENTAL listings here right now (not sales)? A rising rental-DOM trend means longer vacancies and softer asking-rent achievability than the comps imply.
- What's the recent tenant-quality profile in this submarket — average credit score on applications, eviction rate, late-payment / NSF rate, and stable-employment percentage? A property-management company in the area should have these aggregated.
- How much new for-sale + rental construction is in the pipeline within 1–3 miles? Heavy new supply typically softens prices + rents 12–24 months out; constrained supply supports both.
CashFlowRE · CFR-TR4JRV4CKNQPQ6
· Data 3 weeks ago
cashflowre.app · 2026-05-29