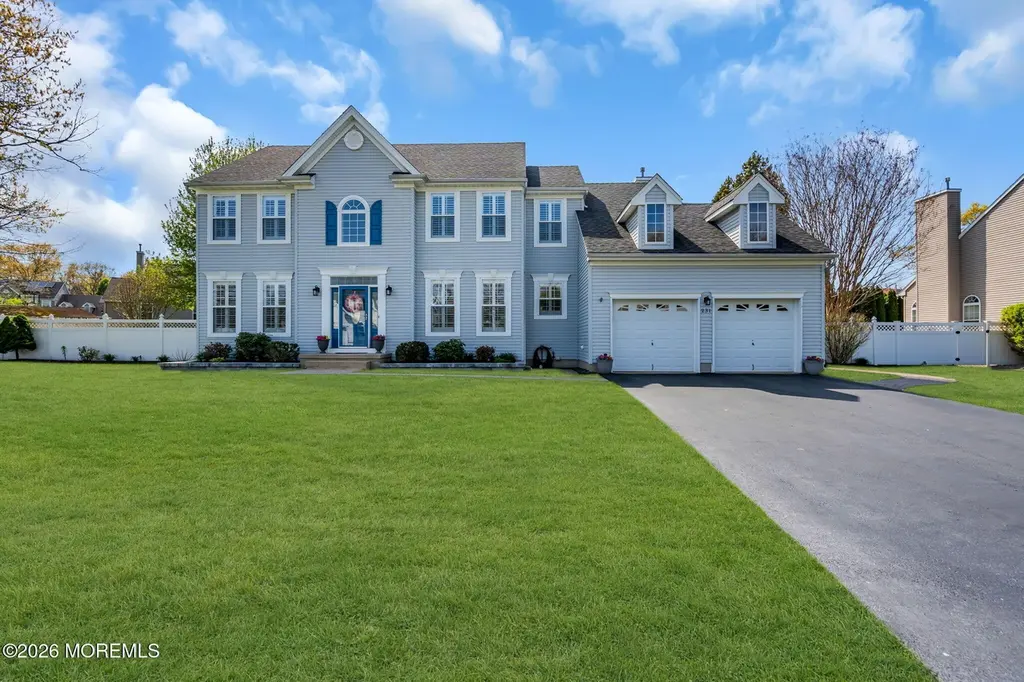
231 Eagleswood Ave · Forked River, NJ
Flood risk 1/10 · Minimal
- FEMA flood zone
- X (unshaded)
- Chance of flooding over 30 yrs
- 0.0%
- Est. flood insurance / yr
- $507 – $1,088
Fire risk 4/10 · Minor
- Est. fire insurance / yr
- $526 – $976
Heat risk 7/10 · Major
- Hot days now (above 99°F)
- 7 days/yr
- Hot days in 30 yrs
- 15 days/yr
Wind risk 6/10 · Moderate
- Chance of severe wind over 30 yrs
- 75.0%
Air-quality risk 3/10 · Minor
- Unhealthy air days now
- 3 days/yr
- Unhealthy air days in 30 yrs
- 3 days/yr
Risk factors via First Street. Map © Google.
Why this score? — see what drove the D+ grade
The composite is a weighted blend of 9 inputs, each scored 0–100. Each bar is that input's sub-score; the figure is the points it added to the 100-point composite (weight × sub-score).
- Cash flow +20.5/30.0
- DSCR +6.5/10.0
- ARV discount +6.4/15.0
- 1% rule +5.4/10.0
- Livability +3.1/5.0
- Schools +3.0/10.0
- Rent growth +2.5/5.0
- Condition / age +2.5/5.0
- Appreciation +0.0/10.0
$779,000
🖨 Deal sheet (PDF) 📄 Offer letter ✓ Due diligence
Listing remarks
IMMACULATE 4-bedroom, 2.5 bath residence in the highly sought-after Cedar Creek Estates of Lanoka Harbor! Step outside to the STUNNING backyard, featuring an in-ground pool with new liner, paver patio, and a shed. Inside, there is a dramatic two-story foyer with elegant tile flooring. The eat-in kitchen features granite countertops, a center island, tile backsplash, 42-inch cabinetry with crown molding, stainless steel appliances, plantation shutters, and sliders to the backyard. The inviting family room impresses with a soaring vaulted ceiling and a cozy fireplace, while the living and dining room combo showcases rich hardwood flooring. There's also a bonus room, first-floor laundry room,
Key facts
- Eat in kitchen
- Paver patio
- Granite countertops
Tags
Property features AI
Exterior
- Parking: Attached 2-car garage
- Utilities: Public sewer
- Home design: Located in Cedar Creek Est subdivision; Cedar Crest / Lacey area
- Construction: Unfinished basement
- Exterior features: Shingle roof
Interior
- Bedrooms: 4 bedrooms
- Flooring: Ceramic tile; Wood
- Bathrooms: 2 full bathrooms; 1 half bathroom (2.5 bathrooms total)
- Heating & cooling: Forced air heating; 2-zone air conditioning
- Interior features: Ceiling fan(s); Wood-burning fireplace (1)
Neighborhood map
What this means for you Summary
Snapshot
- This is a 4-bed/3.0-bath single-family listed at $779k.
Deal economics
- At list price, monthly cash flow is $1k ($12k/yr) — positive.
- The deal already cash-flows at list — no discount required.
- Meets the 1% rule at list price ($8k rent vs $779k).
- Cap rate 7.9% vs local median 3.2% in Forked River — top-decile yield for the area; either an underpriced asset or a hidden risk that comps aren't pricing in. Stress-test before assuming the spread holds.
Location & tenants
- Location reads 61/100 on livability (#464 in NJ) — a middle-class / working-renter tenant base. Strengths: housing A+, crime A-, employment A-; Watch: amenities F, commute F, cost of living F.
- Lacey Township School District (suburban): math 22% / reading 43% proficiency, ranked #299 of 472 in NJ (top 63%) — families likely to look elsewhere, expect single-tenant / working-renter base with shorter leases; only 19% free/reduced lunch — higher-income household profile.
- Zoned schools: Lanoka Harbor Elementary School (math 32% / reading 42%, grade F, #528 of 1,303 statewide, top 43%, 443 students, 27% FRL); Mill Pond Elementary School (math 18% / reading 39%, grade F, #332 of 431 statewide, top 77%, 680 students, 27% FRL); Lacey Township High School (math 25% / reading 49%, grade F, #217 of 399 statewide, top 57%, 1,222 students, 24% FRL).
- Market conditions: 57 active listings in the ZIP; 2 comparable units currently listed for rent nearby; 4,434 units permitted in Ocean County in 2024 (868 in 5+ unit buildings).
Forward outlook
- Local home prices are declining (-3.0%/yr); year-one equity from $5k of loan paydown is wiped out by about $23k of value loss. Plan a longer hold.
- Ocean County population projected to shrink 8% by 2050 — rents likely to lag national; underwrite the cash flow, not the appreciation.
Negotiation context
- Only 7 days on market — expect competitive offers; lowballing is unlikely to land.
- 2 sale attempts with the ask held roughly flat each time — persistent listings suggest the price (not the market) is what's stuck; bring a comps-based counter.
Risks & watch-outs
- Climate carrying-cost: major wind risk, 75% chance of damaging wind over 30y; extreme-heat days projected 7→15/yr by 2055 (HVAC capex compounding) — expect insurance premiums to compound above CPI over the hold.
Questions for the listing agent
- Is there a deadline driving the sale (1031 exchange, divorce, estate, relocation)? That informs how much negotiation room exists.
- The area grade is low — what's the realistic commute time and amenity access for the typical tenant pool here? Any planned neighborhood developments (good or bad) we should know about?
- What's the average days-on-market for RENTAL listings here right now (not sales)? A rising rental-DOM trend means longer vacancies and softer asking-rent achievability than the comps imply.
- What's the recent tenant-quality profile in this submarket — average credit score on applications, eviction rate, late-payment / NSF rate, and stable-employment percentage? A property-management company in the area should have these aggregated.
- How much new for-sale + rental construction is in the pipeline within 1–3 miles? Heavy new supply typically softens prices + rents 12–24 months out; constrained supply supports both.
Investment metrics
- 1% rule
- 1.04% ✓
- Cap rate
- 7.87%
- Cash-on-cash
- 5.63%
- DSCR
- 1.25
- GRM
- 8.0
CMA / ARV
- ARV (median comp)
- $759,797
- List price
- $779,000
- Delta
- 2.53%
- Verdict
- FAIR
- Comps
- 20 within 1.0 mi
Show comp detail 12 sales within ~0.75 mi
| Address | Dist | Beds/Ba | Sqft | Sold | Price | $/sf | Match |
|---|---|---|---|---|---|---|---|
| 109 Foxhollow Dr | 0.34mi | 4/2.5 | 2,568 (+2%) | 0mo | $579,000 | $225 | 79 |
| 747 Hill St | 0.16mi | 4/3.0 | 2,307 (-9%) | 7mo | $860,000 | $373 | 72 |
| 26 Jacqueline Ct | 0.57mi | 4/2.5 | 2,594 (+3%) | 4mo | $715,000 | $276 | 64 |
| 689 Colgate Ave | 0.54mi | 4/2.5 | 2,579 (+2%) | 8mo | $780,000 | $302 | 63 |
| 424 Continental St | 0.70mi | 4/2.5 | 2,600 (+3%) | 1mo | $760,000 | $292 | 60 |
| 201 Pheasant Hollow Dr | 0.36mi | 4/2.5 | 2,254 (-11%) | 7mo | $599,000 | $266 | 57 |
| 3 Easy St | 0.64mi | 5/3.0 (+1) | 2,608 (+3%) | 3mo | $725,000 | $278 | 57 |
| 80 Haines St | 0.46mi | 3/2.0 (-1) | 2,328 (-8%) | 7mo | $580,000 | $249 | 50 |
| 551 Rosewood Dr | 0.41mi | 5/2.0 (+1) | 2,233 (-12%) | 6mo | $610,000 | $273 | 47 |
| 551 Rosewood Dr Unit 551 R | 0.41mi | 5/2.0 (+1) | 2,233 (-12%) | 6mo | $610,000 | $273 | 47 |
| 15 Jacqueline Ct | 0.59mi | 4/2.5 | 2,224 (-12%) | 8mo | $630,000 | $283 | 44 |
| 718 Amherst Rd | 0.74mi | 3/2.0 (-1) | 2,300 (-9%) | 1mo | $780,000 | $339 | 41 |
Match score weights: distance 35% · size 25% · config 20% · recency 20%. Top-matched comps best support the ARV.
Projected returns pro-forma
-3.0% appreciation · 3.0% rent growth · sell at horizon
- IRR
- -7.6%
- Equity multiple
- 0.72×
- Total profit
- $-60,862
- Equity at exit
- $116,151
- IRR
- 2.0%
- Equity multiple
- 1.14×
- Total profit
- $31,556
- Equity at exit
- $67,354
Cash invested: $218,120 (down + closing). Projections, not guarantees.
Landlord ↔ Tenant lean methodology
- Overall (STATE)
- 21 Tenant-Leaning
- State New Jersey
- 21 Tenant-Leaning · D+6
- County
- — inherits STATE
- City
- — inherits STATE
ZIP-level market 08734
- Active inventory
- 57
- Price-to-rent
- 8.0×
Monthly cashflow live
- Estimated rent
- $8,139 medium interval (Pro) →
- Mortgage (P&I)
- −$4,085
- Tax from tax record
- −$996 /mo · $11,955/yr
- Insurance
- −$325
- HOA
- −$0
- Vacancy / Maint / Mgmt
- −$1,709
- Net cashflow
- $1,024
Break-even live
Sensitivity live
| Price | -10% $1,465 | -5% $1,245 | +0% $1,024 | +5% $804 | +10% $583 |
|---|---|---|---|---|---|
| Rent | -10% $381 | -5% $703 | +0% $1,024 | +5% $1,346 | +10% $1,667 |
| Rate | -1.0pp $1,417 | -0.5pp $1,222 | base $1,024 | +0.5pp $822 | +1.0pp $617 |
UW: 25.0% down · 7.5% · 30yr · 1.5% tax · 5.0% vac · 8.0% maint · 8.0% mgmt
Financing live
Cash to close
- Down payment
- $194,750
- Closing costs
- $23,370
- Reserves months
- —
- Total cash needed
- —
Loan-product check · same deal, 3 products live
Conventional
25% down · 7.5% · 30yr
- Down + closing
- —
- Monthly P&I
- —
- Monthly cashflow
- —
- DSCR
- —
- Eligible?
- —
Personal DTI + credit; lowest rate.
DSCR
20% down · 8.5% · 30yr
- Down + closing
- —
- Monthly P&I
- —
- Monthly cashflow
- —
- DSCR
- —
- Eligible?
- —
No personal income docs; deal must DSCR.
Hard money
10% down · 12.0% · 12mo
- Down + closing
- —
- Monthly P&I
- —
- Monthly cashflow
- —
- DSCR
- —
- Eligible?
- —
Short-term bridge; refi at stabilization.
Rent comps 2 comps
| Address | Beds | Baths | Sqft | Rent | $/sqft | DOM | Units | Dist |
|---|---|---|---|---|---|---|---|---|
| 605 Farrelly Ave Bayville, NJ | 5.0 | 3.0 | 2274 | $3,500 | $1.54 | 45d | 1 | 1.07mi |
| 406 Lawrence Dr Lanoka Harbor, NJ | 3.0 | 2.0 | 1836 | $16,000 | $8.71 | 0d | 1 | 1.46mi |
Listing history 2 events
-
2026-05-07status Pending 1049-char remark
-
2026-04-30$779,000 Active 1049-char remark
ⓘ Source: listings_history table (triggers on properties + properties_extension) + one-shot
backfill from property_details.listing_events for pre-trigger history.
Tax reassessment forecast NJ · Partial reset (capped growth)
- Current annual tax
- $11,955 · $996/mo
- Projected year-2 tax
- $15,676 · $1,306/mo
- Expected delta
- +$3,721/yr (+$310/mo · 31.1%)
ⓘ Screening estimate from a state-policy table — verify with the county assessor before closing.
Climate risk First Street
- Flood 1/10 Low FEMA zone X (unshaded) · 0% chance over 30 yrs
- Wildfire 4/10 Moderate
- Heat 7/10 Severe 7 d/yr ≥99°F today · 15 d/yr by 30 yrs out
- Wind 6/10 Major 75% chance of damaging wind over 30 yrs
- Air quality 3/10 Moderate 3 unhealthy d/yr today · 3 by 30 yrs out
Nearby sold comps map
Loading sold comps map…
Walkable amenities ~0.75 mi
Loading nearby amenities…
Taxation est. · year 1
- Rental income
- $97,674
- − Mortgage interest
- −$43,636
- − Property taxes
- −$11,955
- − Insurance
- −$3,895
- − Repairs & maintenance
- −$7,814
- − Management
- −$7,814
- − Depreciation
- −$22,662
- Taxable loss
- −$102
- Est. tax savings @ 24.0%
- +$24
- After-tax cash flow
- $12,315/yr
For passive investors: Depreciation is non-cash, so a rental often shows a tax loss while cash-flowing — sheltering income. Rental losses are passive: they offset passive income freely, and up to $25,000/yr can offset ordinary (W-2) income if you actively participate and your MAGI is under $100k (phasing out to $0 by $150k); unused losses carry forward. On sale, claimed depreciation is recaptured at up to 25%, and gains may owe capital-gains tax (a 1031 exchange can defer both). Figures are a year-1 estimate at your 24.0% rate — not tax advice; consult a CPA.
Schools (NCES district)
- District
- Lacey Township School District
- NCES district ID
- 3408100
- Math proficiency
- 22% ▼ -18.00%
- Reading proficiency
- 43% ▼ -11.00%
- Median HH income
- $73,331
- Composite
- 30.42/100
- National rank
- #6242
- State rank
- #299 of 472 in NJ
Livability — Forked River
- Score
- 61/100
- State rank
- #464
- US rank
- #17753
Category grades
Schools grade is shown separately in the Schools card above.
Census & demographics
- Population (ZIP)
- 8,028
Population outlook (Ocean County) Hauer SSP2
- Today (2025)
- 586,991 people
- By 2030
- 581,403 · -1.0%
- By 2040
- 564,913 · -3.8%
- By 2050
- 538,149 · -8.3%
- By 2075
- 468,845 · -20.1%
- By 2100
- 350,297 · -40.3%
Race, ethnicity, and origin ACS 2023
- Neighborhood character
- Predominantly White (93%)
- Race & ethnicity
- White 93% Hispanic / Latino 5% Two or more races 3%
- Common ancestry
- Romanian 7% Subsaharan African 3% Slovak 3%
- Foreign-born
- 2% · Canada
- Languages at home
- 98% English-only · Spanish 1%
Political lean MEDSL · Ocean
- 2024 margin
- Solid R (+36.0) · D 31.4% · R 67.4% · Other 1.2%
- 2008→2024 swing
- -17.6pp toward R · 2008: -18.4pp · 2024: -36.0pp
- All cycles
- 2024: R+36.0 2020: R+28.7 2016: R+34.0 2012: R+17.7 2008: R+18.4
Not yet ingested
- Civics
- —
Market trends
- HPI YoY
- ▼ -225.83%
- Current HPI
- 368.8557
- Rent YoY
- —
- Metro
- —
- State GDP YoY
- ▲ 2.05%
- F500 in state
- 34
Industry mix (Fortune 500 HQ in NJ)
| Industry | F500 HQs | Revenue |
|---|---|---|
| Consumer Goods | 3 | $31B |
|
||
| Pharmaceuticals | 2 | $153B |
|
||
| Technology | 2 | $21B |
|
||
| Insurance | 2 | $20B |
|
||
| Healthcare | 2 | $19B |
|
||
| Financial Services | 1 | $70B |
|
||
Price history
+0.0% since first listed5 events — show timeline
- 2026-06-11 Pending — MOMLS
- 2026-06-11 Listed $779,000 MOMLS
- 2026-06-04 Sold (MLS) — MOMLS
- 2026-05-07 Pending — MOMLS
- 2026-04-30 Listed $779,000 MOMLS
Property tax history
+3.5%/yrLatest (2025): $11,955 · +7.9% YoY. Source: county tax records.
Cash-flow waterfall
monthlySold comps — $/sqft
last 12 mo · ≤1 miLoading sold comps…