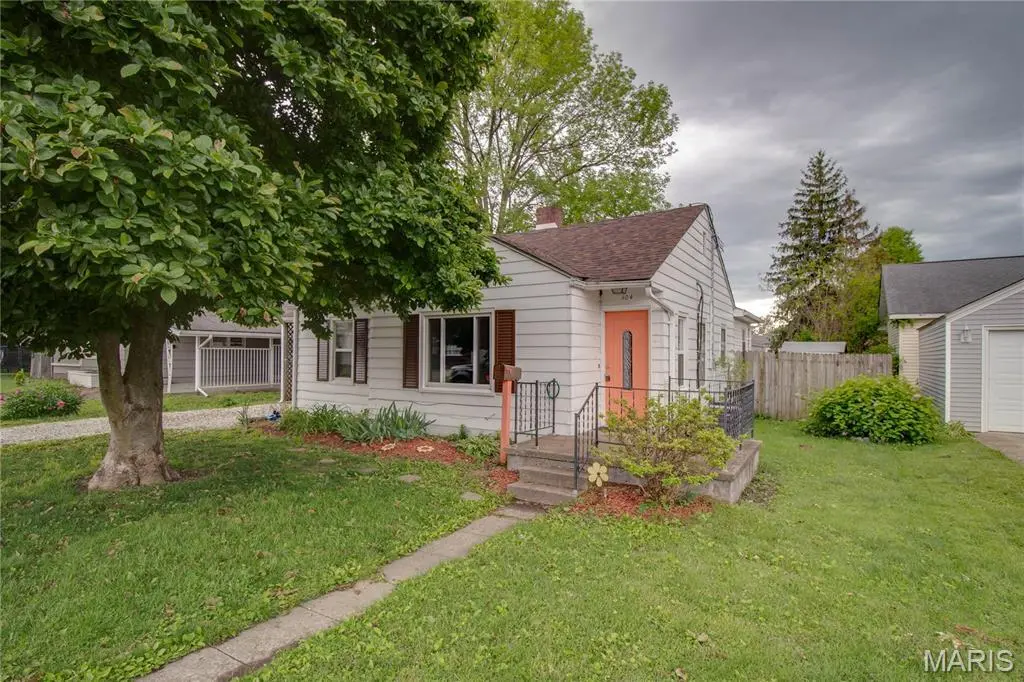
304 Harrison St
Jerseyville, IL 62052
$85,000C+
2 bd · 1.0 ba ·
951 sqft ·
Built 1946
· SingleFamily
· Pending
· 10 DOM
Cashflow @ list (25.0% down · 7.5%)
Estimated rent
$860/mo
Mortgage (P&I)
−$446
Tax + insurance
−$174
HOA
−$0
Vac / Maint / Mgmt
−$181
Net cashflow
$59/mo
Annual
$712/yr
Cap rate
7.13%
Cash-on-cash
2.99%
DSCR
1.13
1% rule
1.01%
Cash to close
$23,800
Investor read
- This is a 2-bed/1.0-bath single-family listed at $85k.
- At list price, monthly cash flow is $59 ($712/yr) — positive.
- The deal already cash-flows at list — no discount required.
- Meets the 1% rule at list price ($860 rent vs $85k).
- Only 10 days on market — expect competitive offers; lowballing is unlikely to land.
- In year one you build about $9k of equity ($588 loan paydown + $8k appreciation (10.0% local appreciation)).
- Location reads 72/100 on livability (#327 in IL) — a middle-class / working-renter tenant base. Strengths: cost of living A+, housing A+, crime A; Watch: health & safety C-, amenities D+, commute F.
- Jersey CUSD 100 (town): math 25% / reading 32% proficiency, ranked #260 of 620 in IL (top 42%) — low school quality limits family demand, transient renter base, plan for 1-2y turnover.
- Zoned schools: Jerseyville East Elem School (math 35% / reading 25%, grade F, #648 of 2,056 statewide, top 32%, 384 students, 0% FRL); Jersey Community Middle School (math 22% / reading 38%, grade F, #246 of 665 statewide, top 38%, 499 students, 0% FRL); Jersey Comm High School (math 23% / reading 30%, grade F, #241 of 693 statewide, top 35%, 1,006 students, 0% FRL) — zoned schools average 0% FRL vs 41% district-wide (41 pts lower); this property's tenant base skews higher-income than the district average.
- Watch-outs: built in 1946 — expect roof / HVAC / electrical / plumbing capex.
- Market conditions: 91 active listings in the ZIP; 2 comparable units currently listed for rent nearby; 101 units permitted in Jersey County in 2024 (68 in 5+ unit buildings).
- Jersey County population projected at -24% by 2050 — secular population decline; favor cash flow + early exit over multi-decade hold.
- 4 sale attempts since 7y ago with the ask held roughly flat each time — persistent listings suggest the price (not the market) is what's stuck; bring a comps-based counter.
- Current owner paid $49k; list at $85k implies a 73% gain — meaningful room to come down on a strong offer.
- At projected returns (10.0% appreciation + 3.0% rent growth), your $24k cash investment doubles in ~3 years — after that, you're playing with house money.
- By year 4, paydown + projected appreciation supports a ~$32k cash-out refi (75% LTV) — recoverable capital for the next deal without selling this one.
- Cap rate 7.1% vs local median 4.6% in Jerseyville — top-decile yield for the area; either an underpriced asset or a hidden risk that comps aren't pricing in. Stress-test before assuming the spread holds.
Questions for listing agent
- Built in 1946 — when were the roof, HVAC, electrical panel, plumbing, and water heater last replaced?
- Is there a deadline driving the sale (1031 exchange, divorce, estate, relocation)? That informs how much negotiation room exists.
- What's the average days-on-market for RENTAL listings here right now (not sales)? A rising rental-DOM trend means longer vacancies and softer asking-rent achievability than the comps imply.
- What's the recent tenant-quality profile in this submarket — average credit score on applications, eviction rate, late-payment / NSF rate, and stable-employment percentage? A property-management company in the area should have these aggregated.
- How much new for-sale + rental construction is in the pipeline within 1–3 miles? Heavy new supply typically softens prices + rents 12–24 months out; constrained supply supports both.
CashFlowRE · CFR-TREZ7QEPW8HKHQ
· Data 4 weeks ago
cashflowre.app · 2026-05-29