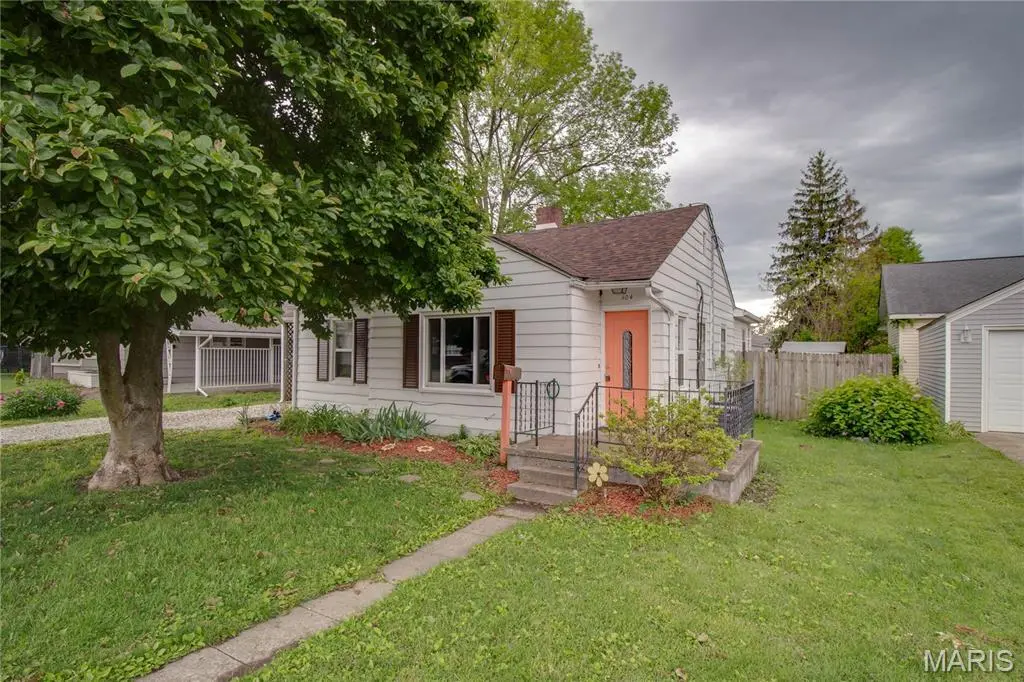
304 Harrison St · Jerseyville, IL
Flood risk 1/10 · Minimal
- FEMA flood zone
- X (unshaded)
- Chance of flooding over 30 yrs
- 0.0%
- Est. flood insurance / yr
- $507 – $1,088
Fire risk 1/10 · Minimal
- Est. fire insurance / yr
- $804 – $1,492
Heat risk 4/10 · Minor
- Hot days now (above 105°F)
- 7 days/yr
- Hot days in 30 yrs
- 20 days/yr
Wind risk 2/10 · Minimal
- Chance of severe wind over 30 yrs
- 1.0%
Air-quality risk 2/10 · Minimal
- Unhealthy air days now
- 0 days/yr
- Unhealthy air days in 30 yrs
- 1 days/yr
Risk factors via First Street. Map © Google.
Why this score? — see what drove the C+ grade
The composite is a weighted blend of 9 inputs, each scored 0–100. Each bar is that input's sub-score; the figure is the points it added to the 100-point composite (weight × sub-score).
- Cash flow +17.1/30.0
- ARV discount +15.0/15.0
- Appreciation +10.0/10.0
- DSCR +5.3/10.0
- 1% rule +5.1/10.0
- Livability +3.6/5.0
- Rent growth +2.5/5.0
- Schools +2.5/10.0
- Condition / age +2.5/5.0
$85,000
🖨 Deal sheet (PDF) 📄 Offer letter ✓ Due diligence
Listing remarks MLS
Great starter home! Second bedroom could also work as a family room. Big back yard!
Key facts
- 5,797 sq ft lot
- Parking
- Built 1946
Property features AI
Exterior
- Parking: Carport (1 space)
- Utilities: Public water; Public sewer; Electricity connected (single phase); Water connected
- Home design: Single-family residence (attached property); One level
- Construction: Aluminum siding; Architectural shingle roof
- Exterior features: Level lot; Shed(s); Chip-and-seal road frontage on a city street
Interior
- Kitchen: Kitchen with adjacent breakfast room; Gas oven; Refrigerator
- Bedrooms: 2 bedrooms on the main level
- Bathrooms: 1 full bathroom on the main level
- Heating & cooling: Forced air heating (natural gas); Central air conditioning
- Interior features: Gas oven; Refrigerator; Gas water heater; Crawl space basement
- Laundry & utility: Main-level laundry room
Neighborhood map
What this means for you Summary
Snapshot
- This is a 2-bed/1.0-bath single-family listed at $85k.
Deal economics
- At list price, monthly cash flow is $59 ($712/yr) — positive.
- The deal already cash-flows at list — no discount required.
- Meets the 1% rule at list price ($860 rent vs $85k).
- Cap rate 7.1% vs local median 4.6% in Jerseyville — top-decile yield for the area; either an underpriced asset or a hidden risk that comps aren't pricing in. Stress-test before assuming the spread holds.
Location & tenants
- Location reads 72/100 on livability (#327 in IL) — a middle-class / working-renter tenant base. Strengths: cost of living A+, housing A+, crime A; Watch: health & safety C-, amenities D+, commute F.
- Jersey CUSD 100 (town): math 25% / reading 32% proficiency, ranked #260 of 620 in IL (top 42%) — low school quality limits family demand, transient renter base, plan for 1-2y turnover.
- Zoned schools: Jerseyville East Elem School (math 35% / reading 25%, grade F, #648 of 2,056 statewide, top 32%, 384 students, 0% FRL); Jersey Community Middle School (math 22% / reading 38%, grade F, #246 of 665 statewide, top 38%, 499 students, 0% FRL); Jersey Comm High School (math 23% / reading 30%, grade F, #241 of 693 statewide, top 35%, 1,006 students, 0% FRL) — zoned schools average 0% FRL vs 41% district-wide (41 pts lower); this property's tenant base skews higher-income than the district average.
- Market conditions: 91 active listings in the ZIP; 2 comparable units currently listed for rent nearby; 101 units permitted in Jersey County in 2024 (68 in 5+ unit buildings).
Forward outlook
- In year one you build about $9k of equity ($588 loan paydown + $8k appreciation (10.0% local appreciation)).
- Jersey County population projected at -24% by 2050 — secular population decline; favor cash flow + early exit over multi-decade hold.
- At projected returns (10.0% appreciation + 3.0% rent growth), your $24k cash investment doubles in ~3 years — after that, you're playing with house money.
- By year 4, paydown + projected appreciation supports a ~$32k cash-out refi (75% LTV) — recoverable capital for the next deal without selling this one.
Negotiation context
- Only 10 days on market — expect competitive offers; lowballing is unlikely to land.
- 4 sale attempts since 7y ago with the ask held roughly flat each time — persistent listings suggest the price (not the market) is what's stuck; bring a comps-based counter.
- Current owner paid $49k; list at $85k implies a 73% gain — meaningful room to come down on a strong offer.
Risks & watch-outs
- Watch-outs: built in 1946 — expect roof / HVAC / electrical / plumbing capex.
Questions for the listing agent
- Built in 1946 — when were the roof, HVAC, electrical panel, plumbing, and water heater last replaced?
- Is there a deadline driving the sale (1031 exchange, divorce, estate, relocation)? That informs how much negotiation room exists.
- What's the average days-on-market for RENTAL listings here right now (not sales)? A rising rental-DOM trend means longer vacancies and softer asking-rent achievability than the comps imply.
- What's the recent tenant-quality profile in this submarket — average credit score on applications, eviction rate, late-payment / NSF rate, and stable-employment percentage? A property-management company in the area should have these aggregated.
- How much new for-sale + rental construction is in the pipeline within 1–3 miles? Heavy new supply typically softens prices + rents 12–24 months out; constrained supply supports both.
Investment metrics
- 1% rule
- 1.01% ✓
- Cap rate
- 7.13%
- Cash-on-cash
- 2.99%
- DSCR
- 1.13
- GRM
- 8.2
CMA / ARV
- ARV (median comp)
- $118,956
- List price
- $85,000
- Delta
- -28.54%
- Verdict
- UNDERPRICED
- Comps
- 20 within 1.0 mi
Show comp detail 12 sales within ~0.75 mi
| Address | Dist | Beds/Ba | Sqft | Sold | Price | $/sf | Match |
|---|---|---|---|---|---|---|---|
| 302 Harrison St | 0.01mi | 2/1.0 | 1,010 (+6%) | 3mo | $119,950 | $119 | 87 |
| 403 Lincoln Ave | 0.12mi | 2/1.0 | 845 (-11%) | 2mo | $71,500 | $85 | 74 |
| 604 W Spruce St | 0.06mi | 2/1.0 | 816 (-14%) | 0mo | $130,500 | $160 | 73 |
| 1007 W Hickory St | 0.29mi | 2/1.5 | 1,016 (+7%) | 0mo | $139,500 | $137 | 73 |
| 705 S Arch St | 0.48mi | 2/1.0 | 885 (-7%) | 6mo | $54,900 | $62 | 61 |
| 621 Cleveland St | 0.32mi | 3/1.0 (+1) | 1,035 (+9%) | 7mo | $113,500 | $110 | 60 |
| 1109 W Exchange St | 0.38mi | 3/1.0 (+1) | 1,050 (+10%) | 2mo | $150,000 | $143 | 59 |
| 908 Walnut St | 0.46mi | 3/1.0 (+1) | 1,008 (+6%) | 6mo | $149,900 | $149 | 59 |
| 101 S Liberty St | 0.31mi | 2/1.0 | 816 (-14%) | 4mo | $99,900 | $122 | 58 |
| 505 S Lafayette St | 0.50mi | 2/1.0 | 1,088 (+14%) | 4mo | $129,000 | $119 | 49 |
| 125 Roberts St | 0.44mi | 3/1.0 (+1) | 1,080 (+14%) | 7mo | $154,900 | $143 | 46 |
| 115 Dressel Dr | 0.74mi | 3/1.0 (+1) | 1,048 (+10%) | 1mo | $145,000 | $138 | 43 |
Match score weights: distance 35% · size 25% · config 20% · recency 20%. Top-matched comps best support the ARV.
Projected returns pro-forma
10.0% appreciation · 3.0% rent growth · sell at horizon
- IRR
- 26.4%
- Equity multiple
- 3.11×
- Total profit
- $50,103
- Equity at exit
- $76,575
- IRR
- 23.2%
- Equity multiple
- 7.08×
- Total profit
- $144,642
- Equity at exit
- $165,136
Cash invested: $23,800 (down + closing). Projections, not guarantees.
Landlord ↔ Tenant lean methodology
- Overall (STATE)
- 43 Moderately Tenant-Leaning
- State Illinois
- 43 Moderately Tenant-Leaning · D+7
- County
- — inherits STATE
- City
- — inherits STATE
ZIP-level market 62052
- Home prices YoY
- 10.2%
- Active inventory
- 91
- Price-to-rent
- 8.2×
Monthly cashflow live
- Estimated rent
- $860 medium interval (Pro) →
- Mortgage (P&I)
- −$446
- Tax from tax record
- −$139 /mo · $1,669/yr
- Insurance
- −$35
- HOA
- −$0
- Vacancy / Maint / Mgmt
- −$181
- Net cashflow
- $59
Break-even live
Sensitivity live
| Price | -10% $107 | -5% $83 | +0% $59 | +5% $35 | +10% $11 |
|---|---|---|---|---|---|
| Rent | -10% $-9 | -5% $25 | +0% $59 | +5% $93 | +10% $127 |
| Rate | -1.0pp $102 | -0.5pp $81 | base $59 | +0.5pp $37 | +1.0pp $15 |
UW: 25.0% down · 7.5% · 30yr · 1.5% tax · 5.0% vac · 8.0% maint · 8.0% mgmt
Financing live
Cash to close
- Down payment
- $21,250
- Closing costs
- $2,550
- Reserves months
- —
- Total cash needed
- —
Loan-product check · same deal, 3 products live
Conventional
25% down · 7.5% · 30yr
- Down + closing
- —
- Monthly P&I
- —
- Monthly cashflow
- —
- DSCR
- —
- Eligible?
- —
Personal DTI + credit; lowest rate.
DSCR
20% down · 8.5% · 30yr
- Down + closing
- —
- Monthly P&I
- —
- Monthly cashflow
- —
- DSCR
- —
- Eligible?
- —
No personal income docs; deal must DSCR.
Hard money
10% down · 12.0% · 12mo
- Down + closing
- —
- Monthly P&I
- —
- Monthly cashflow
- —
- DSCR
- —
- Eligible?
- —
Short-term bridge; refi at stabilization.
Rent comps 2 comps
| Address | Beds | Baths | Sqft | Rent | $/sqft | DOM | Units | Dist |
|---|---|---|---|---|---|---|---|---|
| 410 George St Unit K Jerseyville, IL | 2.0 | 1.0 | 800 | $775 | $0.97 | 12d | 1 | 1.02mi |
| 211 W County Rd Jerseyville, IL | 2.0 | 1.0 | 786 | $950 | $1.21 | 3d | 1 | 1.06mi |
Listing history 12 events
-
2026-05-15status Pending 386-char remark
-
2026-05-05$85,000 Active 386-char remark
-
2020-03-12status Pending 83-char remark
Show marketing remark (83 chars)
Great starter home! Second bedroom could also work as a family room. Big back yard!
-
2020-03-12soldstatus Closed 83-char remark
Show marketing remark (83 chars)
Great starter home! Second bedroom could also work as a family room. Big back yard!
-
2020-03-12soldstatus $49,000
Show marketing remark (83 chars)
Great starter home! Second bedroom could also work as a family room. Big back yard!
-
2020-03-12soldstatus $49,000
Show marketing remark (83 chars)
Great starter home! Second bedroom could also work as a family room. Big back yard!
-
2020-02-05historical Active Under Contract 83-char remark
Show marketing remark (83 chars)
Great starter home! Second bedroom could also work as a family room. Big back yard!
-
2019-10-11status Active 83-char remark
Show marketing remark (83 chars)
Great starter home! Second bedroom could also work as a family room. Big back yard!
-
2019-10-07historical Active Under Contract 83-char remark
Show marketing remark (83 chars)
Great starter home! Second bedroom could also work as a family room. Big back yard!
-
2019-07-11price $54,900 83-char remark
Show marketing remark (83 chars)
Great starter home! Second bedroom could also work as a family room. Big back yard!
-
2019-06-04$57,000 Active 83-char remark
Show marketing remark (83 chars)
Great starter home! Second bedroom could also work as a family room. Big back yard!
-
2019-06-04$54,900
Show marketing remark (83 chars)
Great starter home! Second bedroom could also work as a family room. Big back yard!
ⓘ Source: listings_history table (triggers on properties + properties_extension) + one-shot
backfill from property_details.listing_events for pre-trigger history.
Tax reassessment forecast IL · Partial reset (capped growth)
- Current annual tax
- $1,669 · $139/mo
- Projected year-2 tax
- $1,799 · $150/mo
- Expected delta
- +$130/yr (+$11/mo · 7.8%)
ⓘ Screening estimate from a state-policy table — verify with the county assessor before closing.
Climate risk First Street
- Flood 1/10 Low FEMA zone X (unshaded) · 0% chance over 30 yrs
- Wildfire 1/10 Low
- Heat 4/10 Moderate 7 d/yr ≥105°F today · 20 d/yr by 30 yrs out
- Wind 2/10 Low 100% chance of damaging wind over 30 yrs
- Air quality 2/10 Low 0 unhealthy d/yr today · 1 by 30 yrs out
Nearby sold comps map
Loading sold comps map…
Walkable amenities ~0.75 mi
Loading nearby amenities…
Taxation est. · year 1
- Rental income
- $10,322
- − Mortgage interest
- −$4,761
- − Property taxes
- −$1,669
- − Insurance
- −$425
- − Repairs & maintenance
- −$826
- − Management
- −$826
- − Depreciation
- −$2,473
- Taxable loss
- −$657
- Est. tax savings @ 24.0%
- +$158
- After-tax cash flow
- $869/yr
For passive investors: Depreciation is non-cash, so a rental often shows a tax loss while cash-flowing — sheltering income. Rental losses are passive: they offset passive income freely, and up to $25,000/yr can offset ordinary (W-2) income if you actively participate and your MAGI is under $100k (phasing out to $0 by $150k); unused losses carry forward. On sale, claimed depreciation is recaptured at up to 25%, and gains may owe capital-gains tax (a 1031 exchange can defer both). Figures are a year-1 estimate at your 24.0% rate — not tax advice; consult a CPA.
Schools (NCES district)
- District
- Jersey CUSD 100
- NCES district ID
- 1720430
- Math proficiency
- 25% ▼ -10.00%
- Reading proficiency
- 32% ▼ -14.00%
- Median HH income
- $52,066
- Composite
- 25.13/100
- National rank
- #7522
- State rank
- #260 of 620 in IL
Livability — Jerseyville
- Score
- 72/100
- State rank
- #327
- US rank
- #6498
Category grades
Schools grade is shown separately in the Schools card above.
Census & demographics
- Census place
- Jerseyville, IL
- City population
- 12,483
- Population (ZIP)
- 12,483
Population outlook (Jersey County) Hauer SSP2
- Today (2025)
- 21,031 people
- By 2030
- 20,138 · -4.2%
- By 2040
- 18,077 · -14.0%
- By 2050
- 15,882 · -24.5%
- By 2075
- 11,718 · -44.3%
- By 2100
- 8,546 · -59.4%
Race, ethnicity, and origin ACS 2023
- Neighborhood character
- Predominantly White (96%)
- Race & ethnicity
- White 96% Two or more races 4% Hispanic / Latino 2%
- Common ancestry
- Slovak 2% Italian 1% Romanian 1%
- Foreign-born
- 1% · Canada
- Languages at home
- 99% English-only · Spanish 1%
Political lean MEDSL · Jersey
- 2024 margin
- Solid R (+50.2) · D 24.1% · R 74.3% · Other 1.6%
- 2008→2024 swing
- -47.5pp toward R · 2008: -2.7pp · 2024: -50.2pp
- All cycles
- 2024: R+50.2 2020: R+48.1 2016: R+46.4 2012: R+23.9 2008: R+2.7
Not yet ingested
- Civics
- —
Market trends
- HPI YoY
- ▲ 23.63%
- Current HPI
- 255.48
- Rent YoY
- —
- Metro
- —
- State GDP YoY
- ▲ 1.59%
- F500 in state
- 60
Industry mix (Fortune 500 HQ in IL)
| Industry | F500 HQs | Revenue |
|---|---|---|
| Insurance | 4 | $201B |
|
||
| Consumer Goods | 4 | $87B |
|
||
| Industrial Machinery | 3 | $64B |
|
||
| Healthcare | 2 | $55B |
|
||
| Retail / Pharmacy | 1 | $148B |
|
||
| Agriculture / Food | 1 | $86B |
|
||
Price history
+54.8% since first listed12 events — show timeline
- 2026-05-15 Pending — MARIS as Distributed by MLS Grid
- 2026-05-05 Listed $85,000 MARIS as Distributed by MLS Grid
- 2020-03-12 Pending — MARIS as Distributed by MLS Grid
- 2020-03-12 Sold (Public Records) $49,000 Public Records
- 2020-03-12 Sold (MLS) — MRED as Distributed by MLS Grid
- 2020-03-12 Sold (MLS) — MARIS as Distributed by MLS Grid
- 2020-02-05 Contingent — MARIS as Distributed by MLS Grid
- 2019-10-11 Relisted — MARIS as Distributed by MLS Grid
- 2019-10-07 Contingent — MARIS as Distributed by MLS Grid
- 2019-07-11 Price Changed $54,900 MARIS as Distributed by MLS Grid
- 2019-06-04 Listed $57,000 MARIS as Distributed by MLS Grid
- 2019-06-04 Listed $54,900 MRED as Distributed by MLS Grid
Property tax history
+12.8%/yrLatest (2024): $1,669 · +6.3% YoY. Source: county tax records.
Cash-flow waterfall
monthlySold comps — $/sqft
last 12 mo · ≤1 miLoading sold comps…