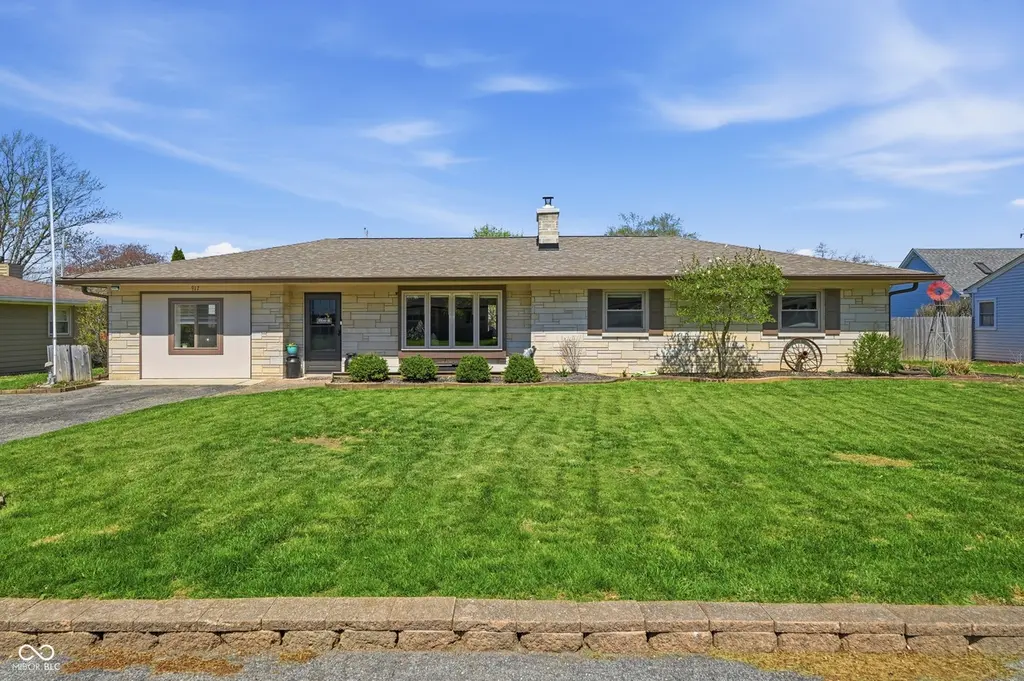
917 Linda Dr
Fortville, IN 46040
$285,000D-
3 bd · 1.0 ba ·
1,636 sqft ·
Built 1955
· SingleFamily
· Pending
· 25 DOM
Cashflow @ list (25.0% down · 7.5%)
Estimated rent
$1,766/mo
Mortgage (P&I)
−$1,495
Tax + insurance
−$169
HOA
−$0
Vac / Maint / Mgmt
−$371
Net cashflow
$-268/mo
Annual
$-3,213/yr
Cap rate
5.17%
Cash-on-cash
-4.03%
DSCR
0.82
1% rule
0.62%
Cash to close
$79,800
Investor read
- This is a 3-bed/1.0-bath single-family listed at $285k.
- At list price, monthly cash flow is $-268 ($-3k/yr) — negative.
- To cash-flow at today's rent, offer at most $238k (16.6% below list).
- To meet the 1% rule (rent ≥ 1% of price), the offer needs to be $177k (38.0% below list).
- It's been on market 25 days — a 2% lower offer ($281k) is reasonable based on typical stale-listing flexibility.
- Recommended offer: $177k (38.0% below list) — sets the bar for 1% rule.
- Local home prices are declining (-3.0%/yr); year-one equity from $2k of loan paydown is wiped out by about $9k of value loss. Plan a longer hold.
- Location reads 69/100 on livability (#189 in IN) — a middle-class / working-renter tenant base. Strengths: crime A+, cost of living A+, housing A+; Watch: amenities F, commute F, health & safety F.
- Mt Vernon Community School Corporation (rural): math 43% / reading 48% proficiency, ranked #70 of 301 in IN (top 23%) — families likely to look elsewhere, expect single-tenant / working-renter base with shorter leases; only 18% free/reduced lunch — higher-income household profile.
- Zoned schools: Fortville Elementary School (math 50% / reading 46%, grade D, #314 of 994 statewide, top 32%, 719 students, 31% FRL); Mt Vernon High School (math 41% / reading 71%, grade C, #73 of 369 statewide, top 20%, 1,431 students, 27% FRL).
- Watch-outs: built in 1955 — expect roof / HVAC / electrical / plumbing capex.
- Market conditions: 303 active listings in the ZIP; 7 comparable units currently listed for rent nearby; rentals leasing fast (median 2d on market — plan ~1-2 weeks tenant-placement turnaround); 1,091 units permitted in Hancock County in 2024 (0 in 5+ unit buildings).
- Hancock County population projected at +7% by 2050 — modest demand growth; plan on rents tracking national, not racing it.
- 2 sale attempts since 13y ago with the ask held roughly flat each time — persistent listings suggest the price (not the market) is what's stuck; bring a comps-based counter.
- Current owner paid $112k; list at $285k implies a 153% gain — meaningful room to come down on a strong offer.
- Cap rate 5.2% vs local median 4.2% in Fortville — meaningfully above typical; check what's discounted (condition, days-on-market, listing class) to confirm the premium yield is real.
Questions for listing agent
- What do current leases actually rent for vs. the listed asking? Can we see a recent rent roll and the last 12 months of T-12 income?
- Built in 1955 — when were the roof, HVAC, electrical panel, plumbing, and water heater last replaced?
- Is there a deadline driving the sale (1031 exchange, divorce, estate, relocation)? That informs how much negotiation room exists.
- The area grade is low — what's the realistic commute time and amenity access for the typical tenant pool here? Any planned neighborhood developments (good or bad) we should know about?
- What's the average days-on-market for RENTAL listings here right now (not sales)? A rising rental-DOM trend means longer vacancies and softer asking-rent achievability than the comps imply.
- What's the recent tenant-quality profile in this submarket — average credit score on applications, eviction rate, late-payment / NSF rate, and stable-employment percentage? A property-management company in the area should have these aggregated.
- How much new for-sale + rental construction is in the pipeline within 1–3 miles? Heavy new supply typically softens prices + rents 12–24 months out; constrained supply supports both.
CashFlowRE · CFR-TS1B2GFB436GN5
· Data 3 weeks ago
cashflowre.app · 2026-05-29