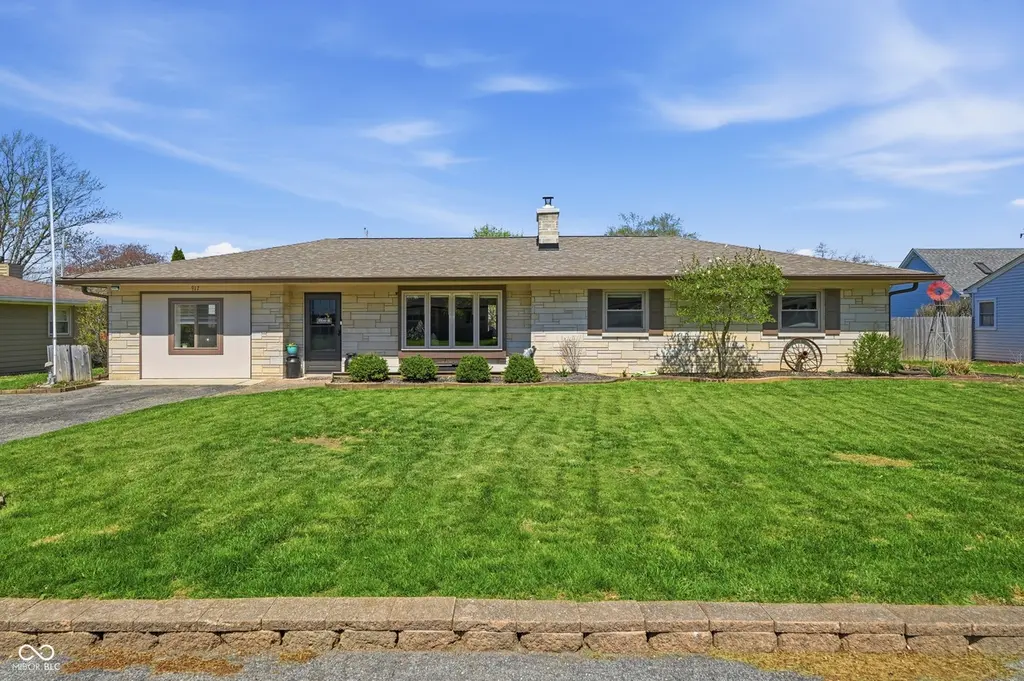
917 Linda Dr · Fortville, IN
Flood risk 1/10 · Minimal
- FEMA flood zone
- X (unshaded)
- Chance of flooding over 30 yrs
- 0.0%
- Est. flood insurance / yr
- $473 – $860
Fire risk 1/10 · Minimal
- Est. fire insurance / yr
- $717 – $1,331
Heat risk 3/10 · Minor
- Hot days now (above 101°F)
- 7 days/yr
- Hot days in 30 yrs
- 18 days/yr
Wind risk 2/10 · Minimal
- Chance of severe wind over 30 yrs
- 1.0%
Air-quality risk 2/10 · Minimal
- Unhealthy air days now
- 1 days/yr
- Unhealthy air days in 30 yrs
- 2 days/yr
Risk factors via First Street. Map © Google.
Why this score? — see what drove the D- grade
The composite is a weighted blend of 9 inputs, each scored 0–100. Each bar is that input's sub-score; the figure is the points it added to the 100-point composite (weight × sub-score).
- ARV discount +11.9/15.0
- Cash flow +8.2/30.0
- Schools +4.1/10.0
- Livability +3.5/5.0
- Rent growth +2.5/5.0
- Condition / age +2.5/5.0
- DSCR +2.2/10.0
- 1% rule +1.2/10.0
- Appreciation +0.0/10.0
$285,000
🖨 Deal sheet 📄 Offer letter ✓ Due diligence
Listing remarks MLS
3 BR Stone Ranch in nice established neighborhood. Home sits on over 1/4 acre with mature trees and landscaped to the hilt. Custom Exterior windows Large Living Rm w/fireplace, built-in bookshelves & newer laminate floors. Kitchen updated w/breakfast bar, pantry and all appliances, Great laundry rm w/ access door to backyard. Shaded backyard has mini barn, play set, burn pit, privacy fence and patio for those summer cookouts. Basement has new furnace.
Key facts
- New garbage disposal
- New exterior doors
- Newer roof
Tags
Property features AI
Finance
- Other: Property sits on approximately 0.26 acre (about 1/4–1/2 acre)
Exterior
- Parking: Asphalt parking (no garage spaces)
- Utilities: Public water; Municipal sewer connected; No solid waste service listed
- Home design: Single-family residence; One level
- Construction: Stone construction; Brick/mortar and slab foundation
- Exterior features: Patio; Porch; Mini barn; Privacy fence; Yard fencing
Interior
- Kitchen: Dishwasher; Disposal; Electric oven; Refrigerator; Eat-in kitchen; Breakfast bar; Pantry
- Bedrooms: 4 bedrooms on the main level; Primary bedroom includes a sitting room; Basement includes a bonus room
- Bathrooms: 1 full bathroom on the main level
- Heating & cooling: Forced air heating (natural gas); Central air conditioning
- Interior features: Attic access; Breakfast bar; Eat-in kitchen; Pantry; Painted woodwork; Unfinished basement; One fireplace with wood-burning insert in the living room; Smoke alarm; Sump pump
- Laundry & utility: Main-level laundry; Washer; Dryer
Neighborhood map
What this means for you Summary
Snapshot
- This is a 3-bed/1.0-bath single-family listed at $285k.
Deal economics
- At list price, monthly cash flow is $-268 ($-3k/yr) — negative.
- To cash-flow at today's rent, offer at most $238k (16.6% below list).
- To meet the 1% rule (rent ≥ 1% of price), the offer needs to be $177k (38.0% below list).
- Recommended offer: $177k (38.0% below list) — sets the bar for 1% rule.
- Cap rate 5.2% vs local median 4.2% in Fortville — meaningfully above typical; check what's discounted (condition, days-on-market, listing class) to confirm the premium yield is real.
Location & tenants
- Location reads 69/100 on livability (#189 in IN) — a middle-class / working-renter tenant base. Strengths: crime A+, cost of living A+, housing A+; Watch: amenities F, commute F, health & safety F.
- Mt Vernon Community School Corporation (rural): math 43% / reading 48% proficiency, ranked #70 of 301 in IN (top 23%) — families likely to look elsewhere, expect single-tenant / working-renter base with shorter leases; only 18% free/reduced lunch — higher-income household profile.
- Zoned schools: Fortville Elementary School (math 50% / reading 46%, grade D, #314 of 994 statewide, top 32%, 719 students, 31% FRL); Mt Vernon High School (math 41% / reading 71%, grade C, #73 of 369 statewide, top 20%, 1,431 students, 27% FRL).
- Market conditions: 303 active listings in the ZIP; 7 comparable units currently listed for rent nearby; rentals leasing fast (median 2d on market — plan ~1-2 weeks tenant-placement turnaround); 1,091 units permitted in Hancock County in 2024 (0 in 5+ unit buildings).
Forward outlook
- Local home prices are declining (-3.0%/yr); year-one equity from $2k of loan paydown is wiped out by about $9k of value loss. Plan a longer hold.
- Hancock County population projected at +7% by 2050 — modest demand growth; plan on rents tracking national, not racing it.
Negotiation context
- It's been on market 25 days — a 2% lower offer ($281k) is reasonable based on typical stale-listing flexibility.
- 2 sale attempts since 13y ago with the ask held roughly flat each time — persistent listings suggest the price (not the market) is what's stuck; bring a comps-based counter.
- Current owner paid $112k; list at $285k implies a 153% gain — meaningful room to come down on a strong offer.
Risks & watch-outs
- Watch-outs: built in 1955 — expect roof / HVAC / electrical / plumbing capex.
Questions for the listing agent
- What do current leases actually rent for vs. the listed asking? Can we see a recent rent roll and the last 12 months of T-12 income?
- Built in 1955 — when were the roof, HVAC, electrical panel, plumbing, and water heater last replaced?
- Is there a deadline driving the sale (1031 exchange, divorce, estate, relocation)? That informs how much negotiation room exists.
- The area grade is low — what's the realistic commute time and amenity access for the typical tenant pool here? Any planned neighborhood developments (good or bad) we should know about?
- What's the average days-on-market for RENTAL listings here right now (not sales)? A rising rental-DOM trend means longer vacancies and softer asking-rent achievability than the comps imply.
- What's the recent tenant-quality profile in this submarket — average credit score on applications, eviction rate, late-payment / NSF rate, and stable-employment percentage? A property-management company in the area should have these aggregated.
- How much new for-sale + rental construction is in the pipeline within 1–3 miles? Heavy new supply typically softens prices + rents 12–24 months out; constrained supply supports both.
Investment metrics
- 1% rule
- 0.62% ✗
- Cap rate
- 5.17%
- Cash-on-cash
- -4.03%
- DSCR
- 0.82
- GRM
- 13.4
CMA / ARV
- ARV (on-the-fly)
- $315,748
- Comps found
- 12
Show comp detail 12 sales within ~0.75 mi
| Address | Dist | Beds/Ba | Sqft | Sold | Price | $/sf | Match |
|---|---|---|---|---|---|---|---|
| 741 Sunset Ln | 0.40mi | 3/1.5 | 1,624 (-1%) | 10mo | $268,000 | $165 | 70 |
| 10190 N Balfer Dr E | 0.56mi | 3/1.5 | 1,524 (-7%) | 4mo | $294,000 | $193 | 58 |
| 10192 N Balfer Dr W | 0.50mi | 3/2.0 | 1,530 (-6%) | 9mo | $270,000 | $176 | 54 |
| 1266 W Limestone Way | 0.39mi | 3/2.0 | 1,450 (-11%) | 6mo | $290,000 | $200 | 54 |
| 1386 W Limestone Way | 0.56mi | 3/2.0 | 1,511 (-8%) | 8mo | $285,000 | $189 | 50 |
| 1270 W Limestone Way | 0.41mi | 3/2.0 | 1,430 (-13%) | 8mo | $278,000 | $194 | 49 |
| 1554 W 1000 N | 0.56mi | 3/2.0 | 1,473 (-10%) | 6mo | $300,000 | $204 | 48 |
| 413 E New York St | 0.63mi | 3/2.0 | 1,461 (-11%) | 3mo | $315,000 | $216 | 46 |
| 751 Laurel Ln | 0.37mi | 4/2.0 (+1) | 1,410 (-14%) | 6mo | $245,000 | $174 | 45 |
| 326 Virginia St | 0.62mi | 4/2.5 (+1) | 1,739 (+6%) | 9mo | $295,000 | $170 | 42 |
| 309 Virginia St | 0.69mi | 3/2.0 | 1,410 (-14%) | 3mo | $253,500 | $180 | 39 |
| 321 Virginia St | 0.65mi | 3/2.0 | 1,420 (-13%) | 11mo | $300,000 | $211 | 35 |
Match score weights: distance 35% · size 25% · config 20% · recency 20%. Top-matched comps best support the ARV.
Projected returns pro-forma
-3.0% appreciation · 3.0% rent growth · sell at horizon
- IRR
- -23.2%
- Equity multiple
- 0.21×
- Total profit
- $-63,395
- Equity at exit
- $42,494
- IRR
- -18.0%
- Equity multiple
- 0.02×
- Total profit
- $-77,816
- Equity at exit
- $24,642
Cash invested: $79,800 (down + closing). Projections, not guarantees.
Landlord ↔ Tenant lean methodology
- Overall (STATE)
- 90 Strongly Landlord-Friendly
- State Indiana
- 90 Strongly Landlord-Friendly · R+11
- County
- — inherits STATE
- City
- — inherits STATE
ZIP-level market 46040
- Home prices YoY
- -24.4%
- Active inventory
- 303
- Price-to-rent
- 13.4×
Monthly cashflow live
- Estimated rent
- $1,766 high interval (Pro) →
- Mortgage (P&I)
- −$1,495
- Tax from tax record
- −$50 /mo · $598/yr
- Insurance
- −$119
- HOA
- −$0
- Vacancy / Maint / Mgmt
- −$371
- Net cashflow
- $-268
Break-even live
UW: 25.0% down · 7.5% · 30yr · 1.5% tax · 5.0% vac · 8.0% maint · 8.0% mgmt
Financing live
Cash to close
- Down payment
- $71,250
- Closing costs
- $8,550
- Reserves months
- —
- Total cash needed
- —
Loan-product check · same deal, 3 products live
Conventional
25% down · 7.5% · 30yr
- Down + closing
- —
- Monthly P&I
- —
- Monthly cashflow
- —
- DSCR
- —
- Eligible?
- —
Personal DTI + credit; lowest rate.
DSCR
20% down · 8.5% · 30yr
- Down + closing
- —
- Monthly P&I
- —
- Monthly cashflow
- —
- DSCR
- —
- Eligible?
- —
No personal income docs; deal must DSCR.
Hard money
10% down · 12.0% · 12mo
- Down + closing
- —
- Monthly P&I
- —
- Monthly cashflow
- —
- DSCR
- —
- Eligible?
- —
Short-term bridge; refi at stabilization.
Rent comps 7 comps
| Address | Beds | Baths | Sqft | Rent | $/sqft | DOM | Units | Dist |
|---|---|---|---|---|---|---|---|---|
| 936 E Broadway St Fortville, IN | 3.0 | 1.5 | 1200 | $1,750 | $1.46 | 23d | 1 | 0.09mi |
| 602 Bradley Dr Fortville, IN | 2.0–3.0 | 2.0 | 1105 | $1,602 | $1.45 | 1d | 8 | 0.34mi |
| 410 Vera Ct Fortville, IN | 3.0 | 1.5 | 1178 | $1,399 | $1.19 | 1d | 2 | 0.56mi |
| 650 N Main St Fortville, IN | 1.0–3.0 | 2.0 | 1189 | $1,939 | $1.63 | 1d | 4 | 0.84mi |
| 10845 Mansfield Way Ingalls, IN | 3.0 | 2.5 | 1516 | $1,825 | $1.20 | 10d | 1 | 1.01mi |
| 10918 Spirit Dr Ingalls, IN | 4.0 | 2.5 | 1633 | $1,695 | $1.04 | 1d | 1 | 1.03mi |
| 405 Thomas Point Dr Fortville, IN | 4.0 | 2.5 | 2132 | $2,995 | $1.40 | 23d | 1 | 1.19mi |
Listing history 8 events
-
2026-05-12status Pending
-
2026-05-04price $285,000
-
2026-04-20price $290,000
-
2026-04-10$299,000 Active
-
2013-09-28historical 459-char remark
Show marketing remark (459 chars)
3 BR Stone Ranch in nice established neighborhood. Home sits on over 1/4 acre with mature trees and landscaped to the hilt. Custom Exterior windows Large Living Rm w/fireplace, built-in bookshelves & newer laminate floors. Kitchen updated w/breakfast bar, pantry and all appliances, Great laundry rm w/ access door to backyard. Shaded backyard has mini barn, play set, burn pit, privacy fence and patio for those summer cookouts. Basement has new furnace.
-
2013-09-27soldstatus $112,500 459-char remark
Show marketing remark (459 chars)
3 BR Stone Ranch in nice established neighborhood. Home sits on over 1/4 acre with mature trees and landscaped to the hilt. Custom Exterior windows Large Living Rm w/fireplace, built-in bookshelves & newer laminate floors. Kitchen updated w/breakfast bar, pantry and all appliances, Great laundry rm w/ access door to backyard. Shaded backyard has mini barn, play set, burn pit, privacy fence and patio for those summer cookouts. Basement has new furnace.
-
2013-06-19$116,000 459-char remark
Show marketing remark (459 chars)
3 BR Stone Ranch in nice established neighborhood. Home sits on over 1/4 acre with mature trees and landscaped to the hilt. Custom Exterior windows Large Living Rm w/fireplace, built-in bookshelves & newer laminate floors. Kitchen updated w/breakfast bar, pantry and all appliances, Great laundry rm w/ access door to backyard. Shaded backyard has mini barn, play set, burn pit, privacy fence and patio for those summer cookouts. Basement has new furnace.
-
2004-06-11soldstatus $114,000
ⓘ Source: listings_history table (triggers on properties + properties_extension) + one-shot
backfill from property_details.listing_events for pre-trigger history.
Tax reassessment forecast IN · Partial reset (capped growth)
- Current annual tax
- $598 · $50/mo
- Projected year-2 tax
- $1,510 · $126/mo
- Expected delta
- +$912/yr (+$76/mo · 152.5%)
ⓘ Screening estimate from a state-policy table — verify with the county assessor before closing.
Climate risk First Street
- Flood 1/10 Low FEMA zone X (unshaded) · 0% chance over 30 yrs
- Wildfire 1/10 Low
- Heat 3/10 Moderate 7 d/yr ≥101°F today · 18 d/yr by 30 yrs out
- Wind 2/10 Low 100% chance of damaging wind over 30 yrs
- Air quality 2/10 Low 1 unhealthy d/yr today · 2 by 30 yrs out
Nearby sold comps map
Loading sold comps map…
Walkable amenities ~0.75 mi
Loading nearby amenities…
Taxation est. · year 1
- Rental income
- $21,197
- − Mortgage interest
- −$15,964
- − Property taxes
- −$598
- − Insurance
- −$1,425
- − Repairs & maintenance
- −$1,696
- − Management
- −$1,696
- − Depreciation
- −$8,291
- Taxable loss
- −$8,473
- Est. tax savings @ 24.0%
- +$2,034
- After-tax cash flow
- $-1,179/yr
For passive investors: Depreciation is non-cash, so a rental often shows a tax loss while cash-flowing — sheltering income. Rental losses are passive: they offset passive income freely, and up to $25,000/yr can offset ordinary (W-2) income if you actively participate and your MAGI is under $100k (phasing out to $0 by $150k); unused losses carry forward. On sale, claimed depreciation is recaptured at up to 25%, and gains may owe capital-gains tax (a 1031 exchange can defer both). Figures are a year-1 estimate at your 24.0% rate — not tax advice; consult a CPA.
Schools (NCES district)
- District
- Mt Vernon Community School Corporation
- NCES district ID
- 1807260
- Math proficiency
- 43% ▼ -12.00%
- Reading proficiency
- 48% ▼ -7.00%
- Median HH income
- $73,671
- Composite
- 41.3/100
- National rank
- #3514
- State rank
- #70 of 301 in IN
Livability — Fortville
- Score
- 69/100
- State rank
- #189
- US rank
- #8710
Category grades
Schools grade is shown separately in the Schools card above.
Census & demographics
- Census place
- Fortville, IN
- Population (ZIP)
- 17,891
Population outlook (Hancock County) Hauer SSP2
- Today (2025)
- 77,820 people
- By 2030
- 79,914 · +2.7%
- By 2040
- 82,734 · +6.3%
- By 2050
- 83,348 · +7.1%
- By 2075
- 82,439 · +5.9%
- By 2100
- 74,181 · -4.7%
Race, ethnicity, and origin ACS 2023
- Neighborhood character
- Predominantly White (83%)
- Race & ethnicity
- White 83% Black 6% Two or more races 4% Asian 4% Hispanic / Latino 2%
- Common ancestry
- Lithuanian 5% Romanian 2% Portuguese 2%
- Foreign-born
- 5% · Canada
- Languages at home
- 94% English-only · Other Indo-European 3% Arabic 1% Spanish 1%
Political lean MEDSL · Hancock
- 2024 margin
- Solid R (+33.7) · D 32.2% · R 65.9% · Other 1.9%
- 2008→2024 swing
- -4.1pp toward R · 2008: -29.6pp · 2024: -33.7pp
- All cycles
- 2024: R+33.7 2020: R+37.5 2016: R+44.8 2012: R+41.0 2008: R+29.6
Not yet ingested
- Civics
- —
Market trends
- HPI YoY
- ▼ -71.54%
- Current HPI
- 221.8703
- Rent YoY
- —
- Metro
- —
- State GDP YoY
- ▲ 2.90%
- F500 in state
- 18
Industry mix (Fortune 500 HQ in IN)
| Industry | F500 HQs | Revenue |
|---|---|---|
| Industrial Machinery | 2 | $37B |
|
||
| Healthcare | 1 | $177B |
|
||
| Pharmaceuticals | 1 | $45B |
|
||
| Metals / Steel | 1 | $18B |
|
||
| Agriculture | 1 | $17B |
|
||
| Packaging | 1 | $12B |
|
||
Price history
+150.0% since first listed8 events — show timeline
- 2026-05-12 Pending — MIBOR as Distributed by MLS Grid
- 2026-05-04 Price Changed $285,000 MIBOR as Distributed by MLS Grid
- 2026-04-20 Price Changed $290,000 MIBOR as Distributed by MLS Grid
- 2026-04-10 Listed $299,000 MIBOR as Distributed by MLS Grid
- 2013-09-28 Listing Removed — MIBOR as Distributed by MLS Grid
- 2013-09-27 Sold (MLS) $112,500 MIBOR as Distributed by MLS Grid
- 2013-06-19 Listed $116,000 MIBOR as Distributed by MLS Grid
- 2004-06-11 Sold (Public Records) $114,000 Public Records
Property tax history
+5.0%/yrLatest (2025): $598 · -7.8% YoY. Source: county tax records.
Cash-flow waterfall
monthlySold comps — $/sqft
last 12 mo · ≤1 miLoading sold comps…