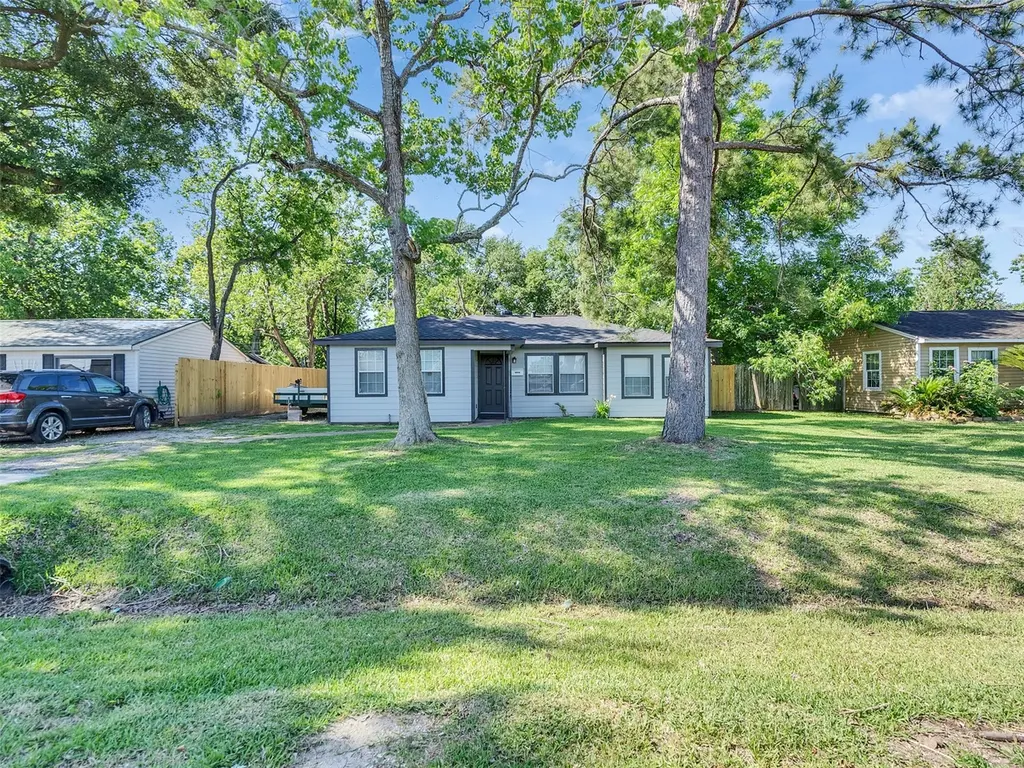
7426 Stephanie Dr
Deer Park, TX 77536
$229,000F
3 bd · 1.0 ba ·
1,176 sqft ·
Built 1955
· SingleFamily
· Active
· 14 DOM
Cashflow @ list (25.0% down · 7.5%)
Estimated rent
$1,561/mo
Mortgage (P&I)
−$1,201
Tax + insurance
−$432
HOA
−$0
Vac / Maint / Mgmt
−$328
Net cashflow
$-400/mo
Annual
$-4,800/yr
Cap rate
4.20%
Cash-on-cash
-7.49%
DSCR
0.67
1% rule
0.68%
Cash to close
$64,120
Investor read
- This is a 3-bed/1.0-bath single-family listed at $229k.
- At list price, monthly cash flow is $-400 ($-5k/yr) — negative.
- To cash-flow at today's rent, offer at most $158k (30.9% below list).
- To meet the 1% rule (rent ≥ 1% of price), the offer needs to be $156k (31.8% below list).
- Only 14 days on market — expect competitive offers; lowballing is unlikely to land.
- Recommended offer: $156k (31.8% below list) — sets the bar for 1% rule.
- Local home prices are declining (-3.0%/yr); year-one equity from $2k of loan paydown is wiped out by about $7k of value loss. Plan a longer hold.
- Location reads 72/100 on livability (#244 in TX) — a middle-class / working-renter tenant base. Strengths: cost of living A+, housing A+, crime A; Watch: amenities C-, commute F.
- Deer Park ISD (suburban): math 50% / reading 47% proficiency, ranked #170 of 826 in TX (top 21%) — families likely to look elsewhere, expect single-tenant / working-renter base with shorter leases.
- Zoned schools: Jp Dabbs El (math 45% / reading 36%, grade F, #1,490 of 4,322 statewide, top 35%, 616 students, 61% FRL); Bonnette J H (math 44% / reading 41%, grade D-, #553 of 1,662 statewide, top 34%, 724 students, 58% FRL); Deer Park H S (math 57% / reading 59%, grade C, #320 of 1,632 statewide, top 20%, 4,026 students, 38% FRL).
- Watch-outs: built in 1955 — expect roof / HVAC / electrical / plumbing capex.
- Market conditions: Rents rising (+2.3%/yr); 170 active listings in the ZIP; 21 comparable units currently listed for rent nearby; rentals leasing fast (median 13d on market — plan ~1-2 weeks tenant-placement turnaround); 43% of comp listings sitting > 30 days — soft ceiling on asking rent; solid renter incomes; 29,883 units permitted in Harris County in 2024 (8,621 in 5+ unit buildings).
- Harris County population projected at +47% by 2050 — long-run rental-demand tailwind backs the buy-and-hold thesis.
- 4 sale attempts since 13y ago with the ask held roughly flat each time — persistent listings suggest the price (not the market) is what's stuck; bring a comps-based counter.
- Climate carrying-cost: major flood risk; severe wind risk, 99% chance of damaging wind over 30y; extreme-heat days projected 7→24/yr by 2055 (HVAC capex compounding) — expect insurance premiums to compound above CPI over the hold.
Questions for listing agent
- What do current leases actually rent for vs. the listed asking? Can we see a recent rent roll and the last 12 months of T-12 income?
- Built in 1955 — when were the roof, HVAC, electrical panel, plumbing, and water heater last replaced?
- Is there a deadline driving the sale (1031 exchange, divorce, estate, relocation)? That informs how much negotiation room exists.
- The area grade is low — what's the realistic commute time and amenity access for the typical tenant pool here? Any planned neighborhood developments (good or bad) we should know about?
- What's the average days-on-market for RENTAL listings here right now (not sales)? A rising rental-DOM trend means longer vacancies and softer asking-rent achievability than the comps imply.
- What's the recent tenant-quality profile in this submarket — average credit score on applications, eviction rate, late-payment / NSF rate, and stable-employment percentage? A property-management company in the area should have these aggregated.
- How much new for-sale + rental construction is in the pipeline within 1–3 miles? Heavy new supply typically softens prices + rents 12–24 months out; constrained supply supports both.
CashFlowRE · CFR-TSH8E1ESW3PMS1
· Data 1 day ago
cashflowre.app · 2026-05-29