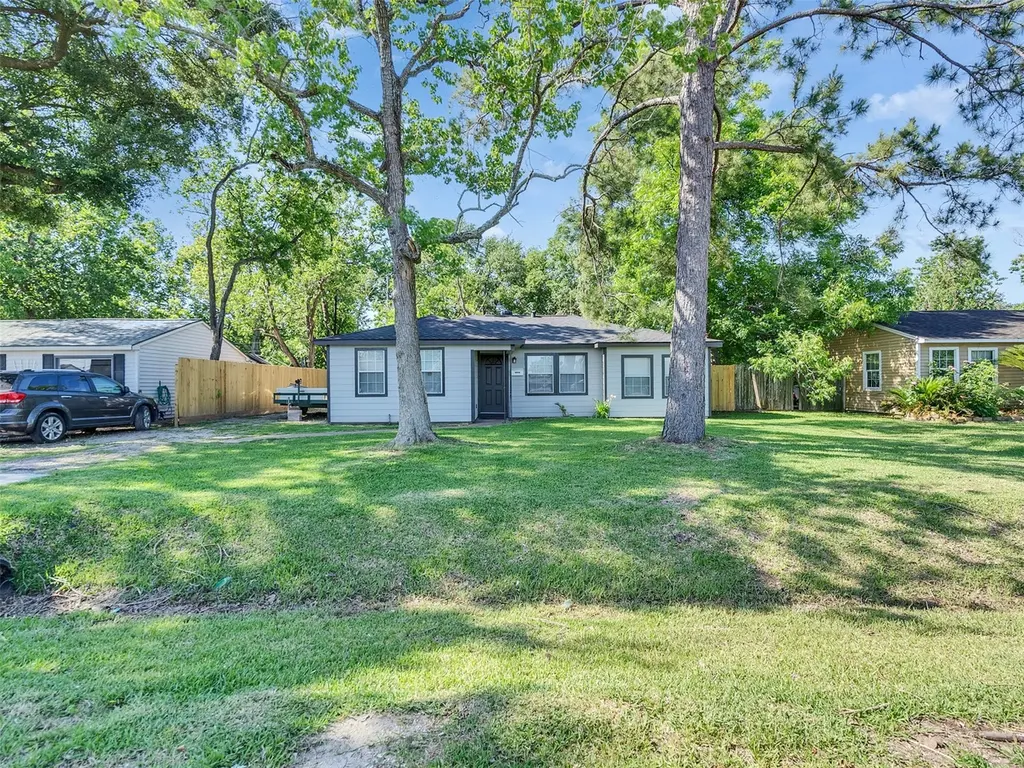
7426 Stephanie Dr · Deer Park, TX
Flood risk 6/10 · Moderate
- FEMA flood zone
- X (unshaded)
- Chance of flooding over 30 yrs
- 0.68%
- Est. flood insurance / yr
- $507 – $1,088
Fire risk 1/10 · Minimal
- Est. fire insurance / yr
- $1,222 – $2,270
Heat risk 9/10 · Severe
- Hot days now (above 108°F)
- 7 days/yr
- Hot days in 30 yrs
- 24 days/yr
Wind risk 9/10 · Severe
- Chance of severe wind over 30 yrs
- 99.0%
Air-quality risk 2/10 · Minimal
- Unhealthy air days now
- 2 days/yr
- Unhealthy air days in 30 yrs
- 2 days/yr
Risk factors via First Street. Map © Google.
Why this score? — see what drove the F grade
The composite is a weighted blend of 9 inputs, each scored 0–100. Each bar is that input's sub-score; the figure is the points it added to the 100-point composite (weight × sub-score).
- Cash flow +6.4/30.0
- Schools +4.3/10.0
- Livability +3.6/5.0
- ARV discount +3.5/15.0
- Rent growth +3.1/5.0
- Condition / age +2.5/5.0
- 1% rule +1.8/10.0
- DSCR +0.7/10.0
- Appreciation +0.0/10.0
$229,000
🖨 Deal sheet (PDF) 📄 Offer letter ✓ Due diligence
Listing remarks MLS
3 bedroom, 1 bath family home situated on a residential lot with large back yard. 2 car detached garage, vinyl siding, spacious living room, kitchen-dining combo and converted garage that can serve as a den or 4th bedroom. This property has been damaged and needs renovation but offers a great value at this price. COME SEE IT!!!
Key facts
- New a/c system
- New privacy fence
- New roof
Tags
Property features AI
Exterior
- Parking: Detached garage (1 car)
- Utilities: Public water; Public sewer
- Home design: Residential property; Single-story (first floor living)
- Construction: Built in 1955; Wood siding exterior; Composition roof; Slab foundation
- Exterior features: Concrete road access; Lot includes other features
Interior
- Kitchen: Free‑standing range; Gas range; Oven
- Bedrooms: Primary bedroom (First floor) — 16 x 10; Bedroom (First floor) — 13 x 9; Bedroom (First floor) — 12 x 9; Bedroom (First floor) — 9 x 9; Living room (First floor) — 15 x 13; Breakfast nook (First floor) — 10 x 8; Kitchen (First floor) — 12 x 9; Seven total rooms
- Bathrooms: 1 full bathroom
- Heating & cooling: Central heating (gas); Central electric air conditioning
- Interior features: Butcher block counters; Pantry; Tub with shower
Neighborhood map
What this means for you Summary
Snapshot
- This is a 3-bed/1.0-bath single-family listed at $229k.
Deal economics
- At list price, monthly cash flow is $-400 ($-5k/yr) — negative.
- To cash-flow at today's rent, offer at most $158k (30.9% below list).
- To meet the 1% rule (rent ≥ 1% of price), the offer needs to be $156k (31.8% below list).
- Recommended offer: $156k (31.8% below list) — sets the bar for 1% rule.
Location & tenants
- Location reads 72/100 on livability (#244 in TX) — a middle-class / working-renter tenant base. Strengths: cost of living A+, housing A+, crime A; Watch: amenities C-, commute F.
- Deer Park ISD (suburban): math 50% / reading 47% proficiency, ranked #170 of 826 in TX (top 21%) — families likely to look elsewhere, expect single-tenant / working-renter base with shorter leases.
- Zoned schools: Jp Dabbs El (math 45% / reading 36%, grade F, #1,490 of 4,322 statewide, top 35%, 616 students, 61% FRL); Bonnette J H (math 44% / reading 41%, grade D-, #553 of 1,662 statewide, top 34%, 724 students, 58% FRL); Deer Park H S (math 57% / reading 59%, grade C, #320 of 1,632 statewide, top 20%, 4,026 students, 38% FRL).
- Market conditions: Rents rising (+2.3%/yr); 170 active listings in the ZIP; 21 comparable units currently listed for rent nearby; rentals leasing fast (median 13d on market — plan ~1-2 weeks tenant-placement turnaround); 43% of comp listings sitting > 30 days — soft ceiling on asking rent; solid renter incomes; 29,883 units permitted in Harris County in 2024 (8,621 in 5+ unit buildings).
Forward outlook
- Local home prices are declining (-3.0%/yr); year-one equity from $2k of loan paydown is wiped out by about $7k of value loss. Plan a longer hold.
- Harris County population projected at +47% by 2050 — long-run rental-demand tailwind backs the buy-and-hold thesis.
Negotiation context
- Only 14 days on market — expect competitive offers; lowballing is unlikely to land.
- 4 sale attempts since 13y ago with the ask held roughly flat each time — persistent listings suggest the price (not the market) is what's stuck; bring a comps-based counter.
Risks & watch-outs
- Watch-outs: built in 1955 — expect roof / HVAC / electrical / plumbing capex.
- Climate carrying-cost: major flood risk; severe wind risk, 99% chance of damaging wind over 30y; extreme-heat days projected 7→24/yr by 2055 (HVAC capex compounding) — expect insurance premiums to compound above CPI over the hold.
Questions for the listing agent
- What do current leases actually rent for vs. the listed asking? Can we see a recent rent roll and the last 12 months of T-12 income?
- Built in 1955 — when were the roof, HVAC, electrical panel, plumbing, and water heater last replaced?
- Is there a deadline driving the sale (1031 exchange, divorce, estate, relocation)? That informs how much negotiation room exists.
- The area grade is low — what's the realistic commute time and amenity access for the typical tenant pool here? Any planned neighborhood developments (good or bad) we should know about?
- What's the average days-on-market for RENTAL listings here right now (not sales)? A rising rental-DOM trend means longer vacancies and softer asking-rent achievability than the comps imply.
- What's the recent tenant-quality profile in this submarket — average credit score on applications, eviction rate, late-payment / NSF rate, and stable-employment percentage? A property-management company in the area should have these aggregated.
- How much new for-sale + rental construction is in the pipeline within 1–3 miles? Heavy new supply typically softens prices + rents 12–24 months out; constrained supply supports both.
Investment metrics
- 1% rule
- 0.68% ✗
- Cap rate
- 4.20%
- Cash-on-cash
- -7.49%
- DSCR
- 0.67
- GRM
- 12.2
CMA / ARV
- ARV (on-the-fly)
- $210,504
- Comps found
- 12
Show comp detail 12 sales within ~0.75 mi
| Address | Dist | Beds/Ba | Sqft | Sold | Price | $/sf | Match |
|---|---|---|---|---|---|---|---|
| 7406 Valeda Dr | 0.08mi | 3/2.0 | 1,155 (-2%) | 7mo | $205,000 | $177 | 83 |
| 7429 Valeda Dr | 0.03mi | 4/2.0 (+1) | 1,154 (-2%) | 4mo | $199,000 | $172 | 83 |
| 7433 W Lambuth Ln | 0.20mi | 3/1.0 | 1,240 (+5%) | 13mo | $219,900 | $177 | 70 |
| 7429 Elbridge Ln | 0.37mi | 3/2.0 | 1,070 (-9%) | 1mo | $219,900 | $206 | 63 |
| 2606 Hillshire Dr | 0.44mi | 3/2.0 | 1,310 (+11%) | 2mo | $250,000 | $191 | 55 |
| 2326 Estate Dr | 0.58mi | 3/1.0 | 1,016 (-14%) | 8mo | $197,500 | $194 | 44 |
| 2618 Kingsdale Dr | 0.33mi | 3/3.0 | 1,318 (+12%) | 15mo | $209,990 | $159 | 43 |
| 7422 Carrie Ln | 0.45mi | 4/2.0 (+1) | 1,314 (+12%) | 8mo | $234,599 | $179 | 43 |
| 3453 Pine Ln | 0.65mi | 3/2.0 | 1,335 (+14%) | 0mo | $219,900 | $165 | 43 |
| 2113 Pickerton Dr | 0.74mi | 3/1.0 | 1,008 (-14%) | 0mo | $162,000 | $161 | 41 |
| 2205 Estate Dr | 0.73mi | 3/1.0 | 1,006 (-14%) | 8mo | $219,000 | $218 | 35 |
| 3437 Pine Ln | 0.69mi | 3/2.0 | 1,336 (+14%) | 9mo | $243,000 | $182 | 34 |
Match score weights: distance 35% · size 25% · config 20% · recency 20%. Top-matched comps best support the ARV.
Projected returns pro-forma
-3.0% appreciation · 2.26% rent growth · sell at horizon
- IRR
- -30.2%
- Equity multiple
- 0.01×
- Total profit
- $-63,683
- Equity at exit
- $34,145
- IRR
- -35.5%
- Equity multiple
- -0.45×
- Total profit
- $-92,700
- Equity at exit
- $19,800
Cash invested: $64,120 (down + closing). Projections, not guarantees.
Landlord ↔ Tenant lean methodology
- Overall (STATE)
- 87 Strongly Landlord-Friendly
- State Texas
- 87 Strongly Landlord-Friendly · R+5
- County
- — inherits STATE
- City
- — inherits STATE
ZIP-level market 77536
- Home prices YoY
- -24.8%
- Rents YoY
- 2.3%
- Active inventory
- 170
- Price-to-rent
- 12.2×
Monthly cashflow live
- Estimated rent
- $1,561 high interval (Pro) →
- Mortgage (P&I)
- −$1,201
- Tax from tax record
- −$337 /mo · $4,043/yr
- Insurance
- −$95
- HOA
- −$0
- Vacancy / Maint / Mgmt
- −$328
- Net cashflow
- $-400
Break-even live
Sensitivity live
| Price | -10% $-270 | -5% $-335 | +0% $-400 | +5% $-465 | +10% $-530 |
|---|---|---|---|---|---|
| Rent | -10% $-523 | -5% $-462 | +0% $-400 | +5% $-338 | +10% $-277 |
| Rate | -1.0pp $-285 | -0.5pp $-342 | base $-400 | +0.5pp $-459 | +1.0pp $-520 |
UW: 25.0% down · 7.5% · 30yr · 1.5% tax · 5.0% vac · 8.0% maint · 8.0% mgmt
Financing live
Cash to close
- Down payment
- $57,250
- Closing costs
- $6,870
- Reserves months
- —
- Total cash needed
- —
Loan-product check · same deal, 3 products live
Conventional
25% down · 7.5% · 30yr
- Down + closing
- —
- Monthly P&I
- —
- Monthly cashflow
- —
- DSCR
- —
- Eligible?
- —
Personal DTI + credit; lowest rate.
DSCR
20% down · 8.5% · 30yr
- Down + closing
- —
- Monthly P&I
- —
- Monthly cashflow
- —
- DSCR
- —
- Eligible?
- —
No personal income docs; deal must DSCR.
Hard money
10% down · 12.0% · 12mo
- Down + closing
- —
- Monthly P&I
- —
- Monthly cashflow
- —
- DSCR
- —
- Eligible?
- —
Short-term bridge; refi at stabilization.
Rent comps 21 comps
| Address | Beds | Baths | Sqft | Rent | $/sqft | DOM | Units | Dist |
|---|---|---|---|---|---|---|---|---|
| 7335 Carrie Ln Deer Park, TX | 2.0 | 1.0 | 870 | $900 | $1.03 | 45d | 1 | 0.41mi |
| 4311 Glenwood Ave Deer Park, TX | 2.0 | 2.0 | 1028 | $1,001 | $0.97 | 45d | 1 | 0.46mi |
| 722 E Brown Ln Deer Park, TX | 3.0 | 2.0 | 1349 | $1,844 | $1.37 | 26d | 1 | 0.49mi |
| 500 W Pasadena Blvd Deer Park, TX | 2.0–4.0 | 2.0–3.0 | 1300 | $1,906 | $1.47 | 0d | 26 | 0.61mi |
| 401 W Pasadena Blvd Deer Park, TX | 1.0–3.0 | 1.0–2.0 | 1038 | $2,090 | $2.01 | 0d | 20 | 0.63mi |
| 7201 Spencer Hwy Pasadena, TX | 1.0–3.0 | 1.0–2.0 | 925 | $1,600 | $1.73 | 45d | 18 | 0.63mi |
| 510 W Pasadena Blvd Deer Park, TX | 2.0 | 2.0 | 1125 | $1,476 | $1.31 | 45d | 1 | 0.66mi |
| 800 W Pasadena Blvd Deer Park, TX | 3.0 | 1.0–2.0 | 965 | $2,510 | $2.60 | 0d | 17 | 0.66mi |
| 7912 Spencer Hwy Pasadena, TX | 2.0 | 2.0 | 950 | $950 | $1.00 | 45d | 1 | 0.69mi |
| 401 McDermott St Deer Park, TX | 1.0–2.0 | 1.0–2.0 | 940 | $1,585 | $1.69 | 7d | 13 | 0.73mi |
| 407 McDermott St Deer Park, TX | 2.0 | 2.0 | 1025 | $1,220 | $1.19 | 45d | 1 | 0.74mi |
| 7878 Spencer Hwy Unit 422 Pasadena, TX | 2.0 | 2.0 | 950 | $1,101 | $1.16 | 12d | 1 | 0.81mi |
| 7878 Spencer Hwy Unit 424 Pasadena, TX | 2.0 | 2.0 | 950 | $1,077 | $1.13 | 7d | 1 | 0.81mi |
| 7878 Spencer Hwy Unit 7911 Pasadena, TX | 3.0 | 2.0 | 1200 | $1,374 | $1.15 | 0d | 1 | 0.81mi |
| 6565 Spencer Hwy Unit 2162 Pasadena, TX | 2.0 | 2.0 | 858 | $1,095 | $1.28 | 6d | 1 | 0.95mi |
| 6565 Spencer Hwy Unit 2047 Pasadena, TX | 2.0 | 2.0 | 858 | $1,120 | $1.31 | 0d | 1 | 0.95mi |
| 6565 Spencer Hwy Unit 6598 Pasadena, TX | 3.0 | 2.0 | 1200 | $1,594 | $1.33 | 0d | 1 | 0.95mi |
| 6565 Spencer Hwy Unit 6622 Pasadena, TX | 2.0 | 2.0 | 858 | $1,079 | $1.26 | 0d | 1 | 0.95mi |
| 6571 Spencer Hwy Pasadena, TX | 2.0 | 2.0 | 870 | $1,110 | $1.28 | 45d | 1 | 0.98mi |
| 3337 Luella Blvd La Porte, TX | 2.0 | 1.0 | 939 | $1,360 | $1.45 | 45d | 1 | 1.18mi |
| 2824 Randolph Rd Unit 12 Pasadena, TX | 3.0 | 2.0 | 840 | $1,095 | $1.30 | 45d | 1 | 1.30mi |
Listing history 9 events
-
2026-06-21days on market $229,000 Active 14 DOM
-
2026-06-18days on market $229,000 Active 11 DOM
-
2026-06-17days on market $229,000 Active 10 DOM
-
2026-06-16days on market $229,000 Active 9 DOM
-
2026-06-15days on market $229,000 Active 8 DOM
-
2026-06-13days on market $229,000 Active 6 DOM
-
2026-06-09days on market $229,000 Active 2 DOM
-
2026-06-08remarks 676-char remark
-
2026-06-08$229,000 Active 1 DOM
ⓘ Source: listings_history table (triggers on properties + properties_extension) + one-shot
backfill from property_details.listing_events for pre-trigger history.
Tax reassessment forecast TX · Resets to sale price
- Current annual tax
- $4,043 · $337/mo
- Projected year-2 tax
- $4,191 · $349/mo
- Expected delta
- +$148/yr (+$12/mo · 3.7%)
ⓘ Screening estimate from a state-policy table — verify with the county assessor before closing.
Climate risk First Street
- Flood 6/10 Major FEMA zone X (unshaded) · 68% chance over 30 yrs
- Wildfire 1/10 Low
- Heat 9/10 Extreme 7 d/yr ≥108°F today · 24 d/yr by 30 yrs out
- Wind 9/10 Extreme 99% chance of damaging wind over 30 yrs
- Air quality 2/10 Low 2 unhealthy d/yr today · 2 by 30 yrs out
Nearby sold comps map
Loading sold comps map…
Walkable amenities ~0.75 mi
Loading nearby amenities…
Taxation est. · year 1
- Rental income
- $18,733
- − Mortgage interest
- −$12,828
- − Property taxes
- −$4,043
- − Insurance
- −$1,145
- − Repairs & maintenance
- −$1,499
- − Management
- −$1,499
- − Depreciation
- −$6,662
- Taxable loss
- −$8,942
- Est. tax savings @ 24.0%
- +$2,146
- After-tax cash flow
- $-2,654/yr
For passive investors: Depreciation is non-cash, so a rental often shows a tax loss while cash-flowing — sheltering income. Rental losses are passive: they offset passive income freely, and up to $25,000/yr can offset ordinary (W-2) income if you actively participate and your MAGI is under $100k (phasing out to $0 by $150k); unused losses carry forward. On sale, claimed depreciation is recaptured at up to 25%, and gains may owe capital-gains tax (a 1031 exchange can defer both). Figures are a year-1 estimate at your 24.0% rate — not tax advice; consult a CPA.
Schools (NCES district)
- District
- Deer Park ISD
- NCES district ID
- 4816530
- Math proficiency
- 50% ▼ -10.00%
- Reading proficiency
- 47% ▼ -3.00%
- Median HH income
- $68,227
- Composite
- 43.3/100
- National rank
- #3039
- State rank
- #170 of 826 in TX
Livability — Deer Park
- Score
- 72/100
- State rank
- #244
- US rank
- #5835
Category grades
Schools grade is shown separately in the Schools card above.
Census & demographics
- Census place
- Deer Park, TX
- County
- Harris County · 4,702,590 people
- City population
- 33,174
- Metro
- Houston-The Woodlands-Sugar Land, TX
- Population (ZIP)
- 33,174
- Household income
- $102,045
- Rent vs Own
- Severe rent burden
- 583.0
Population outlook (Harris County) Hauer SSP2
- Today (2025)
- 5,571,493 people
- By 2030
- 6,089,821 · +9.3%
- By 2040
- 7,142,806 · +28.2%
- By 2050
- 8,185,864 · +46.9%
- By 2075
- 10,574,329 · +89.8%
- By 2100
- 12,109,958 · +117.4%
Race, ethnicity, and origin ACS 2023
- Neighborhood character
- Majority White (58%)
- Race & ethnicity
- White 58% Hispanic / Latino 36% Two or more races 15% Black 3% Native American 1%
- Hispanic origin (detail)
- Mexican 33%
- Common ancestry
- Italian 3% Slovak 2% Lithuanian 2%
- Foreign-born
- 7% · Canada
- Languages at home
- 83% English-only · Spanish 17%
Political lean MEDSL · Harris
- 2024 margin
- Lean D (+5.5) · D 52.0% · R 46.4% · Other 1.6%
- 2008→2024 swing
- +3.9pp toward D · 2008: 1.6pp · 2024: 5.5pp
- All cycles
- 2024: D+5.5 2020: D+13.3 2016: D+12.4 2012: D+0.1 2008: D+1.6
Not yet ingested
- Civics
- —
Market trends
- HPI YoY
- ▼ -83.30%
- Current HPI
- 253.1973
- Rent YoY
- ▲ 2.26%
- Metro
- Houston-The Woodlands-Sugar Land, TX
- State GDP YoY
- ▲ 3.95%
- F500 in state
- 110
Industry mix (Fortune 500 HQ in TX)
| Industry | F500 HQs | Revenue |
|---|---|---|
| Energy | 16 | $1,198B |
|
||
| Technology | 5 | $198B |
|
||
| Engineering / Construction | 4 | $72B |
|
||
| Energy Services | 3 | $60B |
|
||
| Utilities | 3 | $41B |
|
||
| Healthcare | 2 | $330B |
|
||
Price history
+473.9% since first listed11 events — show timeline
- 2026-06-07 Listed $229,000 HARMLS
- 2016-07-29 Sold (Public Records) — Public Records
- 2013-04-22 Sold (MLS) — HARMLS
- 2013-03-27 Pending — HARMLS
- 2013-03-21 Relisted — HARMLS
- 2013-02-27 Pending — HARMLS
- 2013-02-23 Relisted — HARMLS
- 2013-02-22 Pending — HARMLS
- 2013-02-19 Listed $39,900 HARMLS
- 2002-01-09 Sold (Public Records) — Public Records
- 1988-01-02 Sold (Public Records) — Public Records
Property tax history
+7.5%/yrLatest (2025): $4,043 · +11.6% YoY. Source: county tax records.
Cash-flow waterfall
monthlySold comps — $/sqft
last 12 mo · ≤1 miLoading sold comps…