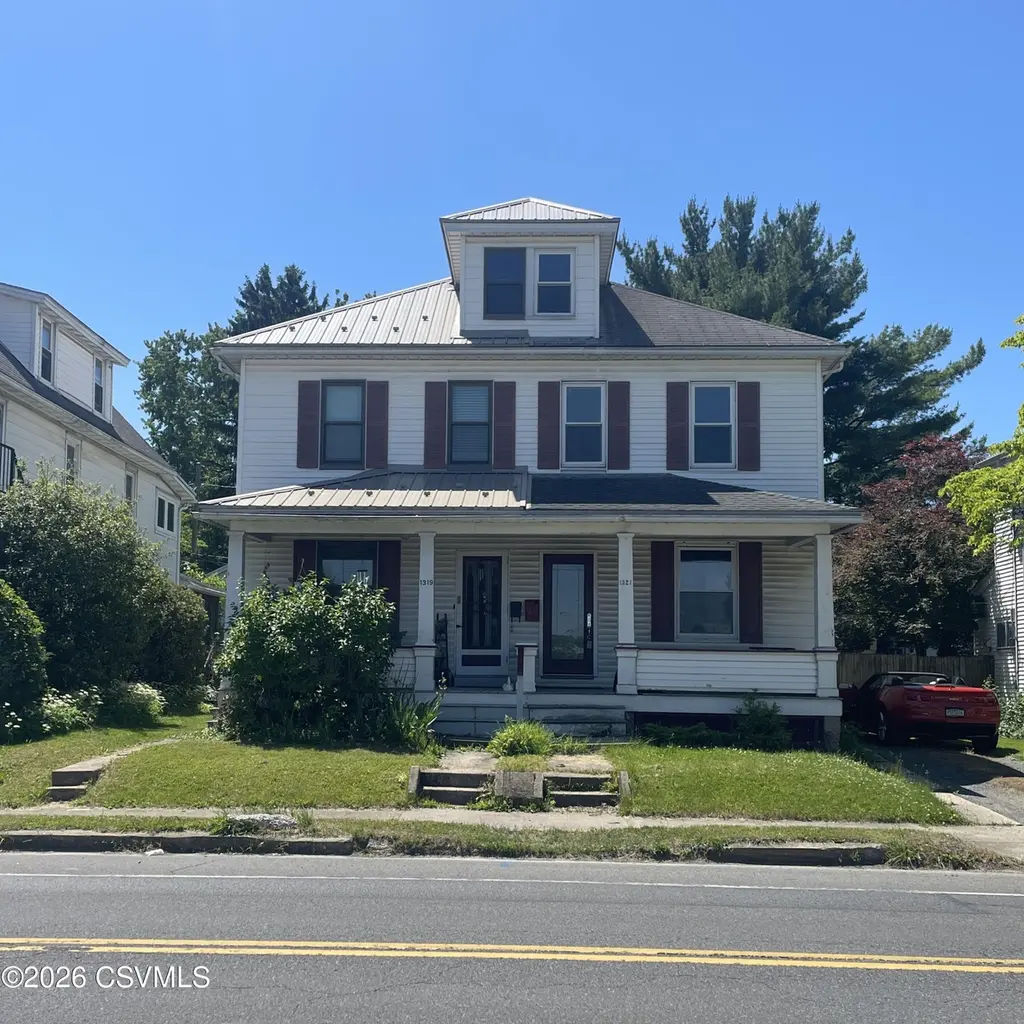
1321 W Market St
Linntown, PA 17837
$132,000B
3 bd · 1.0 ba ·
1,361 sqft ·
Built 1930
· Other
· Pending
· 9 DOM
Cashflow @ list (25.0% down · 7.5%)
Estimated rent
$2,277/mo
Mortgage (P&I)
−$692
Tax + insurance
−$217
HOA
−$0
Vac / Maint / Mgmt
−$478
Net cashflow
$889/mo
Annual
$10,670/yr
Cap rate
14.38%
Cash-on-cash
28.87%
DSCR
2.28
1% rule
1.73%
Cash to close
$36,960
Investor read
- This is a 3-bed/1.0-bath other listed at $132k.
- At list price, monthly cash flow is $889 ($11k/yr) — positive.
- The deal already cash-flows at list — no discount required.
- Meets the 1% rule at list price ($2k rent vs $132k).
- Only 9 days on market — expect competitive offers; lowballing is unlikely to land.
- Local home prices are declining (-3.0%/yr); year-one equity from $913 of loan paydown is wiped out by about $4k of value loss. Plan a longer hold.
- Location reads 84/100 on livability (#86 in PA, #636 nationally) — a professional / high-income tenant draw. Strengths: crime A+, housing A+, health & safety A+; Watch: amenities D-, commute F.
- Lewisburg Area SD (town): math 65% / reading 74% proficiency, ranked #31 of 539 in PA (top 6%) — acceptable for families but not a draw, mixed tenant base, ~2y average lease.
- Watch-outs: built in 1930 — expect roof / HVAC / electrical / plumbing capex.
- Market conditions: 52 active listings in the ZIP; solid renter incomes; 49 units permitted in Union County in 2024 (0 in 5+ unit buildings).
- Union County population projected at +5% by 2050 — modest demand growth; plan on rents tracking national, not racing it.
- 2 sale attempts since 9y ago with the ask held roughly flat each time — persistent listings suggest the price (not the market) is what's stuck; bring a comps-based counter.
- Current owner paid $100k; 32% above their basis — modest negotiation headroom, anchor on the comps not their cost.
- At projected returns (-3.0% appreciation + 3.0% rent growth), your $37k cash investment doubles in ~5 years — after that, you're playing with house money.
- Climate carrying-cost: extreme-heat days projected 7→15/yr by 2055 (HVAC capex compounding) — expect insurance premiums to compound above CPI over the hold.
- Cap rate 14.4% vs local median 2.5% in Linntown — top-decile yield for the area; either an underpriced asset or a hidden risk that comps aren't pricing in. Stress-test before assuming the spread holds.
- This rent runs 31% of the median local income ($89k/yr) — at the standard rent-burdened threshold; future hikes will face affordability resistance.
Questions for listing agent
- Built in 1930 — when were the roof, HVAC, electrical panel, plumbing, and water heater last replaced?
- Is there a deadline driving the sale (1031 exchange, divorce, estate, relocation)? That informs how much negotiation room exists.
- Schools are B-rated — typically a magnet for longer-tenancy family renters. What's the average tenant stay here, and is there a school-zone premium baked into asking?
- What's the average days-on-market for RENTAL listings here right now (not sales)? A rising rental-DOM trend means longer vacancies and softer asking-rent achievability than the comps imply.
- What's the recent tenant-quality profile in this submarket — average credit score on applications, eviction rate, late-payment / NSF rate, and stable-employment percentage? A property-management company in the area should have these aggregated.
- How much new for-sale + rental construction is in the pipeline within 1–3 miles? Heavy new supply typically softens prices + rents 12–24 months out; constrained supply supports both.
CashFlowRE · CFR-TTJPRH9P043HHJ
· Data 4 days ago
cashflowre.app · 2026-05-29