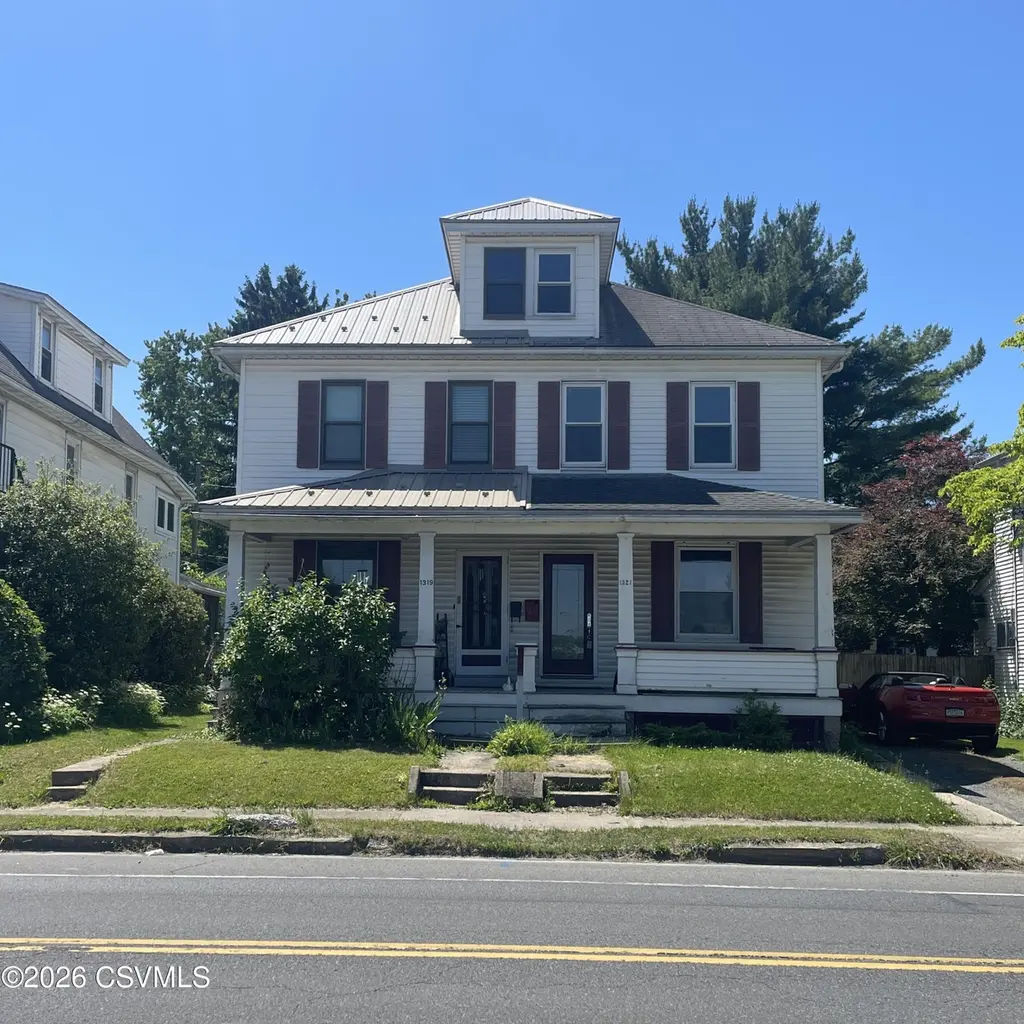
1321 W Market St · Linntown, PA
Flood risk 1/10 · Minimal
- FEMA flood zone
- X (unshaded)
- Chance of flooding over 30 yrs
- 0.0%
- Est. flood insurance / yr
- $473 – $860
Fire risk 1/10 · Minimal
- Est. fire insurance / yr
- $511 – $949
Heat risk 5/10 · Moderate
- Hot days now (above 101°F)
- 7 days/yr
- Hot days in 30 yrs
- 15 days/yr
Wind risk 2/10 · Minimal
- Chance of severe wind over 30 yrs
- 3.0%
Air-quality risk 2/10 · Minimal
- Unhealthy air days now
- 0 days/yr
- Unhealthy air days in 30 yrs
- 1 days/yr
Risk factors via First Street. Map © Google.
Why this score? — see what drove the B grade
The composite is a weighted blend of 9 inputs, each scored 0–100. Each bar is that input's sub-score; the figure is the points it added to the 100-point composite (weight × sub-score).
- Cash flow +30.0/30.0
- 1% rule +10.0/10.0
- DSCR +10.0/10.0
- ARV discount +7.5/15.0
- Schools +5.9/10.0
- Livability +4.2/5.0
- Rent growth +2.5/5.0
- Condition / age +2.5/5.0
- Appreciation +0.0/10.0
$132,000
🖨 Deal sheet 📄 Offer letter ✓ Due diligence
Listing remarks MLS
Just move in and enjoy this great half double in the Linntown area-totally remodeled throughout! Driveway for off street parking-very convenient location-to Giant shopping and lots of other shops or in the other direction convenient to schools-Linntown Elementary and and Middle school. If you're looking for exercise just a block to the rail trail!! call/text Linda 570 490 7029 for your tour!!
Key facts
- Off street parking
- 3,484 sq ft lot
- Built 1930
Tags
Property features AI
Finance
- Financial info: Annual tax listed
- HOA & community: Street lights in the community
Exterior
- Parking: Off-street parking
- Utilities: Public water; Public sewer
- Home design: Single family residence; Residential property
- Construction: Vinyl siding; Wood siding; Frame construction; Shingle roof; No listed foundation details; Built on lot zoned R-1
- Exterior features: Enclosed porch; Porch
Interior
- Kitchen: Dishwasher; Refrigerator
- Bedrooms: Total rooms: 10
- Flooring: Hardwood
- Bathrooms: 1 full bathroom; 1 half bathroom
- Heating & cooling: Heating available; Ceiling fan(s); No central air
- Interior features: Water softener; Unfinished basement
- Laundry & utility: Washer; Dryer
Neighborhood map
What this means for you Summary
Snapshot
- This is a 3-bed/1.0-bath other listed at $132k.
Deal economics
- At list price, monthly cash flow is $889 ($11k/yr) — positive.
- The deal already cash-flows at list — no discount required.
- Meets the 1% rule at list price ($2k rent vs $132k).
- Cap rate 14.4% vs local median 2.5% in Linntown — top-decile yield for the area; either an underpriced asset or a hidden risk that comps aren't pricing in. Stress-test before assuming the spread holds.
Location & tenants
- Location reads 84/100 on livability (#86 in PA, #636 nationally) — a professional / high-income tenant draw. Strengths: crime A+, housing A+, health & safety A+; Watch: amenities D-, commute F.
- Lewisburg Area SD (town): math 65% / reading 74% proficiency, ranked #31 of 539 in PA (top 6%) — acceptable for families but not a draw, mixed tenant base, ~2y average lease.
- Market conditions: 52 active listings in the ZIP; solid renter incomes; 49 units permitted in Union County in 2024 (0 in 5+ unit buildings).
- This rent runs 31% of the median local income ($89k/yr) — at the standard rent-burdened threshold; future hikes will face affordability resistance.
Forward outlook
- Local home prices are declining (-3.0%/yr); year-one equity from $913 of loan paydown is wiped out by about $4k of value loss. Plan a longer hold.
- Union County population projected at +5% by 2050 — modest demand growth; plan on rents tracking national, not racing it.
- At projected returns (-3.0% appreciation + 3.0% rent growth), your $37k cash investment doubles in ~5 years — after that, you're playing with house money.
Negotiation context
- Only 9 days on market — expect competitive offers; lowballing is unlikely to land.
- 2 sale attempts since 9y ago with the ask held roughly flat each time — persistent listings suggest the price (not the market) is what's stuck; bring a comps-based counter.
- Current owner paid $100k; 32% above their basis — modest negotiation headroom, anchor on the comps not their cost.
Risks & watch-outs
- Watch-outs: built in 1930 — expect roof / HVAC / electrical / plumbing capex.
- Climate carrying-cost: extreme-heat days projected 7→15/yr by 2055 (HVAC capex compounding) — expect insurance premiums to compound above CPI over the hold.
Questions for the listing agent
- Built in 1930 — when were the roof, HVAC, electrical panel, plumbing, and water heater last replaced?
- Is there a deadline driving the sale (1031 exchange, divorce, estate, relocation)? That informs how much negotiation room exists.
- Schools are B-rated — typically a magnet for longer-tenancy family renters. What's the average tenant stay here, and is there a school-zone premium baked into asking?
- What's the average days-on-market for RENTAL listings here right now (not sales)? A rising rental-DOM trend means longer vacancies and softer asking-rent achievability than the comps imply.
- What's the recent tenant-quality profile in this submarket — average credit score on applications, eviction rate, late-payment / NSF rate, and stable-employment percentage? A property-management company in the area should have these aggregated.
- How much new for-sale + rental construction is in the pipeline within 1–3 miles? Heavy new supply typically softens prices + rents 12–24 months out; constrained supply supports both.
Investment metrics
- 1% rule
- 1.73% ✓
- Cap rate
- 14.38%
- Cash-on-cash
- 28.87%
- DSCR
- 2.28
- GRM
- 4.8
CMA / ARV
No comps found within radius.
Projected returns pro-forma
-3.0% appreciation · 3.0% rent growth · sell at horizon
- IRR
- 23.2%
- Equity multiple
- 1.95×
- Total profit
- $35,275
- Equity at exit
- $19,682
- IRR
- 31.2%
- Equity multiple
- 3.81×
- Total profit
- $103,773
- Equity at exit
- $11,413
Cash invested: $36,960 (down + closing). Projections, not guarantees.
Landlord ↔ Tenant lean methodology
- Overall (STATE)
- 62 Landlord-Friendly
- State Pennsylvania
- 62 Landlord-Friendly · EVEN
- County
- — inherits STATE
- City
- — inherits STATE
ZIP-level market 17837
- Active inventory
- 52
- Price-to-rent
- 4.8×
Monthly cashflow live
- Estimated rent
- $2,277 medium interval (Pro) →
- Mortgage (P&I)
- −$692
- Tax from tax record
- −$162 /mo · $1,949/yr
- Insurance
- −$55
- HOA
- −$0
- Vacancy / Maint / Mgmt
- −$478
- Net cashflow
- $889
Break-even live
UW: 25.0% down · 7.5% · 30yr · 1.5% tax · 5.0% vac · 8.0% maint · 8.0% mgmt
Financing live
Cash to close
- Down payment
- $33,000
- Closing costs
- $3,960
- Reserves months
- —
- Total cash needed
- —
Loan-product check · same deal, 3 products live
Conventional
25% down · 7.5% · 30yr
- Down + closing
- —
- Monthly P&I
- —
- Monthly cashflow
- —
- DSCR
- —
- Eligible?
- —
Personal DTI + credit; lowest rate.
DSCR
20% down · 8.5% · 30yr
- Down + closing
- —
- Monthly P&I
- —
- Monthly cashflow
- —
- DSCR
- —
- Eligible?
- —
No personal income docs; deal must DSCR.
Hard money
10% down · 12.0% · 12mo
- Down + closing
- —
- Monthly P&I
- —
- Monthly cashflow
- —
- DSCR
- —
- Eligible?
- —
Short-term bridge; refi at stabilization.
Listing history 8 events
-
2026-06-16status $132,000 Pending 9 DOM
-
2026-06-15days on market $132,000 Active 9 DOM
-
2026-06-14days on market $132,000 Active 7 DOM
-
2026-06-12days on market $132,000 Active 6 DOM
-
2026-06-09days on market $132,000 Active 3 DOM
-
2026-06-08days on market $132,000 Active 2 DOM
-
2026-06-07remarks 210-char remark
-
2026-06-07$132,000 Active 1 DOM
ⓘ Source: listings_history table (triggers on properties + properties_extension) + one-shot
backfill from property_details.listing_events for pre-trigger history.
Tax reassessment forecast PA · Partial reset (capped growth)
- Current annual tax
- $1,949 · $162/mo
- Projected year-2 tax
- $2,018 · $168/mo
- Expected delta
- +$68/yr (+$6/mo · 3.5%)
ⓘ Screening estimate from a state-policy table — verify with the county assessor before closing.
Climate risk First Street
- Flood 1/10 Low FEMA zone X (unshaded) · 0% chance over 30 yrs
- Wildfire 1/10 Low
- Heat 5/10 Major 7 d/yr ≥101°F today · 15 d/yr by 30 yrs out
- Wind 2/10 Low 3% chance of damaging wind over 30 yrs
- Air quality 2/10 Low 0 unhealthy d/yr today · 1 by 30 yrs out
Nearby sold comps map
Loading sold comps map…
Walkable amenities ~0.75 mi
Loading nearby amenities…
Taxation est. · year 1
- Rental income
- $27,324
- − Mortgage interest
- −$7,394
- − Property taxes
- −$1,949
- − Insurance
- −$660
- − Repairs & maintenance
- −$2,186
- − Management
- −$2,186
- − Depreciation
- −$3,840
- Taxable income
- $9,109
- Est. tax owed @ 24.0%
- −$2,186
- After-tax cash flow
- $8,484/yr
For passive investors: Depreciation is non-cash, so a rental often shows a tax loss while cash-flowing — sheltering income. Rental losses are passive: they offset passive income freely, and up to $25,000/yr can offset ordinary (W-2) income if you actively participate and your MAGI is under $100k (phasing out to $0 by $150k); unused losses carry forward. On sale, claimed depreciation is recaptured at up to 25%, and gains may owe capital-gains tax (a 1031 exchange can defer both). Figures are a year-1 estimate at your 24.0% rate — not tax advice; consult a CPA.
Schools (NCES district)
- District
- Lewisburg Area SD
- NCES district ID
- 4213590
- Math proficiency
- 65% ▼ -2.00%
- Reading proficiency
- 74% ▼ -7.00%
- Median HH income
- $50,129
- Composite
- 58.94/100
- National rank
- #968
- State rank
- #31 of 539 in PA
Livability — Linntown
- Score
- 84/100
- State rank
- #86
- US rank
- #636
Category grades
Schools grade is shown separately in the Schools card above.
Census & demographics
- Census place
- Linntown, PA
- County
- Union County · 18,403 people
- Metro
- Lewisburg, PA
- Population (ZIP)
- 18,403
- Household income
- $88,975
- Rent vs Own
- Severe rent burden
- 456.0
Population outlook (Union County) Hauer SSP2
- Today (2025)
- 46,664 people
- By 2030
- 47,704 · +2.2%
- By 2040
- 48,798 · +4.6%
- By 2050
- 49,048 · +5.1%
- By 2075
- 47,491 · +1.8%
- By 2100
- 41,817 · -10.4%
Race, ethnicity, and origin ACS 2023
- Neighborhood character
- Predominantly White (86%)
- Race & ethnicity
- White 86% Hispanic / Latino 5% Black 4% Asian 3% Two or more races 3%
- Hispanic origin (detail)
- Puerto Rican 2%
- Common ancestry
- Romanian 2% Italian 2% Lithuanian 2%
- Foreign-born
- 4% · Canada, China, Jamaica
- Languages at home
- 89% English-only · Spanish 4% German/W. Germanic 2% Other Indo-European 2%
Political lean MEDSL · Union
- 2024 margin
- Strong R (+23.4) · D 37.8% · R 61.2%
- 2008→2024 swing
- -8.9pp toward R · 2008: -14.5pp · 2024: -23.4pp
- All cycles
- 2024: R+23.4 2020: R+24.3 2016: R+25.7 2012: R+23.5 2008: R+14.5
Not yet ingested
- Civics
- —
Market trends
- HPI YoY
- ▼ -122.78%
- Current HPI
- 177.9792
- Rent YoY
- —
- Metro
- Lewisburg, PA
- State GDP YoY
- ▲ 1.68%
- F500 in state
- 34
Industry mix (Fortune 500 HQ in PA)
| Industry | F500 HQs | Revenue |
|---|---|---|
| Healthcare | 2 | $309B |
|
||
| Insurance | 2 | $27B |
|
||
| Telecommunications / Media | 1 | $124B |
|
||
| Industrial Distribution | 1 | $22B |
|
||
| Financial Services | 1 | $20B |
|
||
| Chemicals / Materials | 1 | $18B |
|
||
Price history
+25.8% since first listed4 events — show timeline
- 2026-06-05 Listed $132,000 CSVBR
- 2017-08-07 Sold (Public Records) $100,000 Public Records
- 2017-07-14 Sold (MLS) $100,000 CSVBR
- 2017-01-10 Listed $104,900 CSVBR
Property tax history
+1.2%/yrLatest (2026): $1,949 · +2.1% YoY. Source: county tax records.
Cash-flow waterfall
monthlySold comps — $/sqft
last 12 mo · ≤1 miLoading sold comps…